Porsche 2015 Annual Report Download - page 129
Download and view the complete annual report
Please find page 129 of the 2015 Porsche annual report below. You can navigate through the pages in the report by either clicking on the pages listed below, or by using the keyword search tool below to find specific information within the annual report.-
 1
1 -
2
-
3
-
4
-
5
-
6
-
7
-
8
-
9
-
10
-
11
-
12
-
13
-
14
-
15
-
16
-
17
-
18
-
19
-
20
-
21
-
22
-
23
-
24
-
25
-
26
-
27
-
28
-
29
-
30
-
31
-
32
-
33
-
34
-
35
-
36
-
37
-
38
-
39
-
40
-
41
-
42
-
43
-
44
-
45
-
46
-
47
-
48
-
49
-
50
-
51
-
52
-
53
-
54
-
55
-
56
-
57
-
58
-
59
-
60
-
61
-
62
-
63
-
64
-
65
-
66
-
67
-
68
-
69
-
70
-
71
-
72
-
73
-
74
-
75
-
76
-
77
-
78
-
79
-
80
-
81
-
82
-
83
-
84
-
85
-
86
-
87
-
88
-
89
-
90
-
91
-
92
-
93
-
94
-
95
-
96
-
97
-
98
-
99
-
100
-
101
-
102
-
103
-
104
-
105
-
106
-
107
-
108
-
109
-
110
-
111
-
112
-
113
-
114
-
115
-
116
-
117
-
118
-
 119
119 -
 120
120 -
 121
121 -
 122
122 -
 123
123 -
 124
124 -
 125
125 -
 126
126 -
 127
127 -
 128
128 -
 129
129 -
 130
130 -
 131
131 -
 132
132 -
 133
133 -
 134
134 -
 135
135 -
 136
136 -
 137
137 -
 138
138 -
 139
139 -
140
-
141
-
142
-
143
-
144
-
145
-
146
-
147
-
148
 |
 |

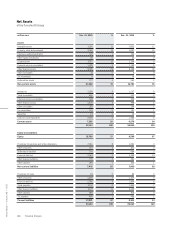
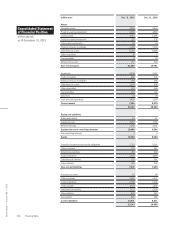
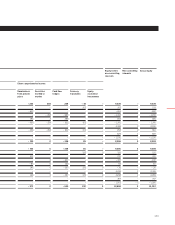
Deferred tax assets amounted to 727 million euro
compared with 562 million euro in the prior year.
As a percentage of total assets, current assets
amount to 26 percent compared to 24 percent
inthe prior year. Inventories increased from
2,157 million euro in the prior year to 2,509 million
euro at the end of the reporting period. In com-
parison to the prior reporting date, there was
anincrease of approximately 5,400 units in new
vehicle inventories.
Non-current and current financial services
receiv ables rose from 1,696 million euro to
1,887 million euro. These items mainly contain
receivables from finance leases and receivables
from customer and dealer financing.
Current other financial assets increased slightly
by 42 million euro to 1,000 million euro. The
decrease in current derivative financial instru-
ments was countered by a slightly higher balance
on the clearing account with Porsche Holding
Stuttgart GmbH.
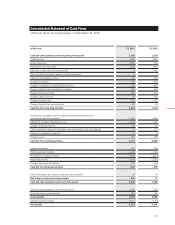
Cash and cash equivalents increased significantly
year on year, climbing by 925 million euro to
2,485 million euro.
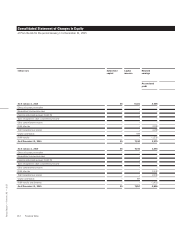
The equity of the Porsche AG Group increased
by1,101 million euro to 10,700 million euro
compared with the prior-year reporting date. The
profit after tax, profit transfer and dividends of
430 million euro together with currency translation
differences, revaluations from pension plans and
acapital contribution by Porsche Holding Stuttgart
GmbH amounting to 707 million euro generated
increases in equity. By contrast, the changes
inthe cash flow hedge reserve in the amount of
307 million euro after tax represented reductions
in equity.
Non-current liabilities mainly relate to financial
liabilities, pension provisions, deferred tax
liabilities, other financial liabilities and other
provisions. They declined by 478 million euro
to7,472 million euro in comparison with the
prior year. Non-current liabilities expressed as
a percentage of total capital decreased from
30 percent in the prior year to 26 percent at the
end of the financial year. At the same time, non-
current financial liabilities fell by 920 million
euro. This decrease primarily reflects the change
in the remaining maturity of a bond in the amount
of 1,000 million euro classified as non-current
in the prior year.
Provisions for pensions and similar obligations
remained unchanged as against the prior year,
at 2,361 million euro.
Non-current other financial liabilities recorded
growth of 395 million euro. The increase mainly
relates to marking derivative financial instru-
ments to market.
Current liabilities increased significantly from
8,511 million euro to 10,971 million euro. Current
liabilities expressed as a percentage of total
capital rose from 33 percent in the prior year to
37 percent as of December 31, 2015. Current
financial liabilities grew by 884 million euro. This
increase primarily reflects the change in the
maturity of a bond in the amount of 1,000 million
euro.
Deferred tax liabilities amounted to 749 million
euro compared with 684 million euro in the
prior year.
Trade payables increased to 2,214 million euro
after 1,856 million euro in the previous year.
This increase is attributable to higher volumes
of investments and business.
Current other financial liabilities amounted to
3,127 million euro (prior year: 2,058 million
euro). The increase mainly relates to marking
derivative financial instruments to market.
125