Mondelez 2014 Annual Report Download - page 7
Download and view the complete annual report
Please find page 7 of the 2014 Mondelez annual report below. You can navigate through the pages in the report by either clicking on the pages listed below, or by using the keyword search tool below to find specific information within the annual report.-
 1
1 -
 2
2 -
 3
3 -
 4
4 -
 5
5 -
 6
6 -
 7
7 -
 8
8 -
 9
9 -
 10
10 -
 11
11 -
 12
12 -
 13
13 -
 14
14 -
 15
15 -
 16
16 -
 17
17 -
 18
18 -
19
-
20
-
21
-
22
-
23
-
24
-
25
-
26
-
27
-
28
-
29
-
30
-
31
-
32
-
33
-
34
-
35
-
36
-
37
-
38
-
39
-
40
-
41
-
42
-
43
-
44
-
45
-
46
-
47
-
48
-
49
-
50
-
51
-
52
-
53
-
54
-
55
-
56
-
57
-
58
-
59
-
60
-
61
-
62
-
63
-
64
-
65
-
66
-
67
-
68
-
69
-
70
-
71
-
72
-
73
-
74
-
75
-
76
-
77
-
78
-
79
-
80
-
81
-
82
-
83
-
84
-
85
-
86
-
87
-
88
-
89
-
90
-
91
-
92
-
93
-
94
-
95
-
96
-
97
-
98
-
99
-
100
-
101
-
102
-
103
-
104
-
105
-
106
-
107
-
108
-
109
-
110
-
111
-
112
-
113
-
114
-
115
-
116
-
117
-
118
-
119
-
120
-
121
-
122
-
123
-
124
-
125
-
126
-
127
-
128
-
129
-
130
-
131
-
132
-
133
-
134
-
135
-
136
-
137
-
138
-
139
-
140
-
141
-
142
-
143
-
144
-
145
-
146
-
147
-
148
-
149
-
150
-
151
-
152
-
153
-
154
-
155
-
156
-
157
-
158
-
159
-
160
-
161
-
162
-
163
-
164
-
165
-
166
-
167
-
168
-
169
-
170
-
171
-
172
-
173
-
174
-
175
-
176
-
177
-
178
-
179
-
180
-
181
-
182
-
183
-
184
-
185
-
186
-
187
-
188
-
189
-
190
-
191
-
192
-
193
-
194
-
195
-
196
-
197
-
198
-
199
-
200
-
201
-
202
-
203
-
204
-
205
-
206
-
207
-
208
-
209
-
210
-
211
 |
 |

Table of Contents
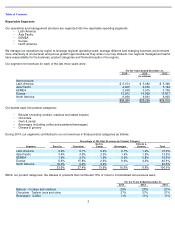
We use segment operating income to evaluate segment performance and allocate resources. We believe it is appropriate to
disclose this measure to help investors analyze our segment performance and trends. For a definition and reconciliation of segment
operating income to consolidated pre-tax earnings as well as other information on our segments, see Note 17, Segment Reporting
.
Our segment operating income for each of the last three years was:
Currency and other items significantly affect the comparability of our consolidated and segment operating results from year to year.
Please see our Management’s Discussion and Analysis of Financial Condition and Results of Operations for a review of our
operating results.
During the last three fiscal years, our segments contributed to segment operating income as reflected below.
Significant Divestitures and Acquisitions
For information on our significant past and planned divestitures and acquisitions, please refer to Note 2, Divestitures and
Acquisitions,
and specifically, our discussion under Planned Coffee Business Transactions and Spin-Off of Kraft Foods Group .
Customers
No single customer accounted for 10% or more of our net revenues from continuing operations in 2014. Our five largest customers
accounted for 15.7% and our ten largest customers accounted for 23.7% of net revenues from continuing operations in 2014.
Seasonality
Demand for our products is generally balanced over the first three quarters of the year and increases in the fourth quarter primarily
because of holidays and other seasonal events.
Competition
We face competition in all aspects of our business. Competitors include large multi-national as well as numerous local and regional
companies. Some competitors have different profit objectives than we do and therefore approach pricing and promotional decisions
differently. We compete based on product quality, brand recognition and loyalty, service, product innovation, taste, convenience,
the ability to identify and satisfy consumer preferences, effectiveness of sales and marketing, routes to market and distribution
networks, promotional activity and price. Improving our market position or introducing a new product requires substantial research,
development, advertising and promotional expenditures. We believe these investments lead to a better value proposition for the
consumer.
4
For the Years Ended December 31,
2014
2013
2012
(in millions)
Segment operating income:
Latin America
$
475
$
570
$
769
Asia Pacific
385
512
657
EEMEA
327
379
506
Europe
1,770
1,699
1,762
North America
922
889
781
$
3,879
$
4,049
$
4,475
For the Years Ended December 31,
2014
2013
2012
Segment operating income:
Latin America
12.3%
14.1%
17.2%
Asia Pacific
9.9%
12.6%
14.7%
EEMEA
8.4%
9.4%
11.3%
Europe
45.6%
42.0%
39.4%
North America
23.8%
21.9%
17.4%
100.0%
100.0%
100.0%