Mondelez 2014 Annual Report Download - page 21
Download and view the complete annual report
Please find page 21 of the 2014 Mondelez annual report below. You can navigate through the pages in the report by either clicking on the pages listed below, or by using the keyword search tool below to find specific information within the annual report.
Table of Contents
PART II
It em 5. Market for Registrant’s Common Equity, Related Stockholder Matters and Issuer Purchases of Equity Securities.
Our Common Stock is listed on The NASDAQ Global Select Market under the symbol “MDLZ.” At January 31, 2015, there were
62,195 holders of record of our Common Stock. Information regarding the market price of our Common Stock and dividends
declared during the last two fiscal years is included in Note 18, Quarterly Financial Data (Unaudited) , to the consolidated financial
statements.
Comparison of Five-Year Cumulative Total Return
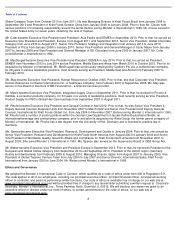
The following graph compares the cumulative total return on our Common Stock with the cumulative total return of the S&P 500
Index and the Mondelē
z International performance peer group index. The graph assumes, in each case, that an initial investment of
$100 is made at the beginning of the five-
year period. The cumulative total return reflects market prices at the end of each year and
the reinvestment of dividends each year (and takes into account the value of Kraft Foods Group, Inc. shares distributed in the Spin-
Off). The vertical line below indicates the October 1, 2012 Spin-Off date and is intended to facilitate comparisons of performance
against peers listed below and the stock market before and following the Spin-Off.
The Mondelēz International performance peer group consists of the following companies considered our market competitors or that
have been selected on the basis of industry, global focus or industry leadership: Campbell Soup Company, The
Coca-Cola Company, Colgate-Palmolive Company, Danone S.A., General Mills, Inc., The Hershey Company, Kellogg Company,
Nestlé S.A., PepsiCo, Inc., The Procter & Gamble Company and Unilever N.V.
This performance graph and other information furnished under this Part II Item 5(a) of this Form 10-K shall not be deemed to be
“soliciting material” or to be “filed” with the SEC or subject to Regulation 14A or 14C, or to the liabilities of Section 18 of the
Exchange Act.
18
Mondel
ē
z
Performance
Date
International
S&P 500
Peer Group
December 31, 2009
$
100.00
$
100.00
$
100.00
December 31, 2010
120.39
115.06
112.26
December 31, 2011
147.64
117.49
120.95
December 31, 2012
158.73
136.30
132.99
December 31, 2013
223.95
180.14
158.54
December 31, 2014
234.22
205.14
171.35


