Mondelez 2014 Annual Report Download - page 6
Download and view the complete annual report
Please find page 6 of the 2014 Mondelez annual report below. You can navigate through the pages in the report by either clicking on the pages listed below, or by using the keyword search tool below to find specific information within the annual report.-
 1
1 -
 2
2 -
 3
3 -
 4
4 -
 5
5 -
 6
6 -
 7
7 -
 8
8 -
 9
9 -
 10
10 -
 11
11 -
 12
12 -
 13
13 -
 14
14 -
 15
15 -
 16
16 -
 17
17 -
18
-
19
-
20
-
21
-
22
-
23
-
24
-
25
-
26
-
27
-
28
-
29
-
30
-
31
-
32
-
33
-
34
-
35
-
36
-
37
-
38
-
39
-
40
-
41
-
42
-
43
-
44
-
45
-
46
-
47
-
48
-
49
-
50
-
51
-
52
-
53
-
54
-
55
-
56
-
57
-
58
-
59
-
60
-
61
-
62
-
63
-
64
-
65
-
66
-
67
-
68
-
69
-
70
-
71
-
72
-
73
-
74
-
75
-
76
-
77
-
78
-
79
-
80
-
81
-
82
-
83
-
84
-
85
-
86
-
87
-
88
-
89
-
90
-
91
-
92
-
93
-
94
-
95
-
96
-
97
-
98
-
99
-
100
-
101
-
102
-
103
-
104
-
105
-
106
-
107
-
108
-
109
-
110
-
111
-
112
-
113
-
114
-
115
-
116
-
117
-
118
-
119
-
120
-
121
-
122
-
123
-
124
-
125
-
126
-
127
-
128
-
129
-
130
-
131
-
132
-
133
-
134
-
135
-
136
-
137
-
138
-
139
-
140
-
141
-
142
-
143
-
144
-
145
-
146
-
147
-
148
-
149
-
150
-
151
-
152
-
153
-
154
-
155
-
156
-
157
-
158
-
159
-
160
-
161
-
162
-
163
-
164
-
165
-
166
-
167
-
168
-
169
-
170
-
171
-
172
-
173
-
174
-
175
-
176
-
177
-
178
-
179
-
180
-
181
-
182
-
183
-
184
-
185
-
186
-
187
-
188
-
189
-
190
-
191
-
192
-
193
-
194
-
195
-
196
-
197
-
198
-
199
-
200
-
201
-
202
-
203
-
204
-
205
-
206
-
207
-
208
-
209
-
210
-
211
 |
 |

Table of Contents
Reportable Segments
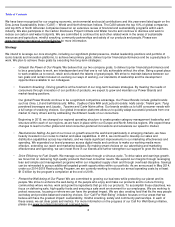
Our operations and management structure are organized into five reportable operating segments:
We manage our operations by region to leverage regional operating scale, manage different and changing business environments
more effectively at a local level and pursue growth opportunities as they arise in our key markets. Our regional management teams
have responsibility for the business, product categories and financial results in the regions.
Our segment net revenues for each of the last three years were:
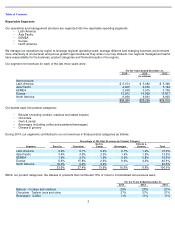
Our brands span five product categories:
During 2014, our segments contributed to our net revenues in these product categories as follows:
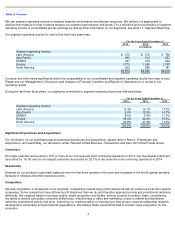
Within our product categories, the classes of products that contributed 10% or more to consolidated net revenues were:
3
• Latin America
• Asia Pacific
• EEMEA
• Europe
• North America
For the Years Ended December 31,
2014
2013
2012
(in millions)
Net revenues:
Latin America
$
5,153
$
5,382
$
5,396
Asia Pacific
4,605
4,952
5,164
EEMEA
3,638
3,915
3,735
Europe
13,912
14,059
13,817
North America
6,936
6,991
6,903
$
34,244
$
35,299
$
35,015
• Biscuits (including cookies, crackers and salted snacks)
• Chocolate
• Gum & candy
•
Beverages (including coffee and powdered beverages)
•
Cheese & grocery
Percentage of 2014 Net Revenues by Product Category
Gum &
Cheese &
Segment
Biscuits
Chocolate
Candy
Beverages
Grocery
Total
Latin America
3.9%
3.1%
3.4%
2.7%
1.9%
15.0%
Asia Pacific
3.4%
4.5%
2.3%
1.4%
1.9%
13.5%
EEMEA
1.9%
3.1%
1.9%
2.9%
0.8%
10.6%
Europe
8.4%
15.8%
2.6%
9.6%
4.2%
40.6%
North America
16.0%
0.9%
3.4%
–
–
20.3%
33.6%
27.4%
13.6%
16.6%
8.8%
100.0%
For the Years Ended December 31,
2014
2013
2012
Biscuits - Cookies and crackers
29%
28%
27%
Chocolate - Tablets, bars and other
27%
27%
27%
Beverages - Coffee
11%
11%
11%