Memorex 2010 Annual Report Download - page 83
Download and view the complete annual report
Please find page 83 of the 2010 Memorex annual report below. You can navigate through the pages in the report by either clicking on the pages listed below, or by using the keyword search tool below to find specific information within the annual report.-
 1
1 -
2
-
3
-
4
-
5
-
6
-
7
-
8
-
9
-
10
-
11
-
12
-
13
-
14
-
15
-
16
-
17
-
18
-
19
-
20
-
21
-
22
-
23
-
24
-
25
-
26
-
27
-
28
-
29
-
30
-
31
-
32
-
33
-
34
-
35
-
36
-
37
-
38
-
39
-
40
-
41
-
42
-
43
-
44
-
45
-
46
-
47
-
48
-
49
-
50
-
51
-
52
-
53
-
54
-
55
-
56
-
57
-
58
-
59
-
60
-
61
-
62
-
63
-
64
-
65
-
66
-
67
-
68
-
69
-
70
-
71
-
72
-
 73
73 -
 74
74 -
 75
75 -
 76
76 -
 77
77 -
 78
78 -
 79
79 -
 80
80 -
 81
81 -
 82
82 -
 83
83 -
 84
84 -
 85
85 -
 86
86 -
 87
87 -
 88
88 -
 89
89 -
 90
90 -
 91
91 -
 92
92 -
 93
93 -
94
-
95
-
96
-
97
-
98
-
99
-
100
-
101
-
102
-
103
-
104
-
105
-
106
 |
 |

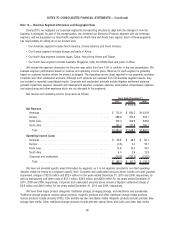
Note 14 — Business Segment Information and Geographic Data
During 2010, we realigned our corporate segments and reporting structure to align with the changes in how the
business is managed. As part of this reorganization, we combined our Electronic Products segment with our Americas
segment, and we separated our Asia Pacific segment into North Asia and South Asia regions. Each of these segments
has responsibility for selling all of our product lines.
•Our Americas segment includes North America, Central America and South America.
•Our Europe segment includes Europe and parts of Africa.
•Our North Asia segment includes Japan, China, Hong Kong, Korea and Taiwan.
•Our South Asia segment includes Australia, Singapore, India, the Middle East and parts of Africa.
We revised the segment information for the prior year within this Form 10-K to conform to the new presentation. We
evaluate segment performance based on revenue and operating income (loss). Revenue for each segment is generally
based on customer location where the product is shipped. The operating income (loss) reported in our segments excludes
corporate and other unallocated amounts. Although such amounts are excluded from the business segment results, they
are included in reported consolidated results. Corporate and unallocated amounts include litigation settlement expense,
goodwill impairment expense, research and development expense, corporate expense, stock-based compensation expense
and restructuring and other expenses which are not allocated to the segments.
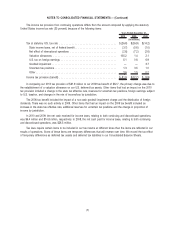
Net revenue and operating income (loss) were as follows:
2010 2009 2008
Years Ended December 31,
(In millions)
Net Revenue
Americas . . . . . . . . . . . . . . . . . . . . . . . . . . . . . . . . . . . . . . . . . . . . . $ 712.9 $ 834.2 $1,002.9
Europe . . . . . . . . . . . . . . . . . . . . . . . . . . . . . . . . . . . . . . . . . . . . . . 289.8 370.5 503.1
North Asia . . . . . . . . . . . . . . . . . . . . . . . . . . . . . . . . . . . . . . . . . . . . 315.2 306.9 308.9
South Asia . . . . . . . . . . . . . . . . . . . . . . . . . . . . . . . . . . . . . . . . . . . . 143.0 137.9 166.1
Total . . . . . . . . . . . . . . . . . . . . . . . . . . . . . . . . . . . . . . . . . . . . . . $1,460.9 $1,649.5 $1,981.0
Operating Income (Loss)
Americas . . . . . . . . . . . . . . . . . . . . . . . . . . . . . . . . . . . . . . . . . . . . . $ 36.8 $ 48.3 $ 58.1
Europe . . . . . . . . . . . . . . . . . . . . . . . . . . . . . . . . . . . . . . . . . . . . . . (0.6) 2.4 16.1
North Asia . . . . . . . . . . . . . . . . . . . . . . . . . . . . . . . . . . . . . . . . . . . . 14.9 15.3 16.7
South Asia . . . . . . . . . . . . . . . . . . . . . . . . . . . . . . . . . . . . . . . . . . . . 4.0 2.6 12.9
Corporate and unallocated . . . . . . . . . . . . . . . . . . . . . . . . . . . . . . . . . (124.8) (130.3) (137.5)
Total . . . . . . . . . . . . . . . . . . . . . . . . . . . . . . . . . . . . . . . . . . . . . . $ (69.7) $ (61.7) $ (33.7)
We have not provided specific asset information by segment, as it is not regularly provided to our chief operating
decision maker for review at a segment specific level. Corporate and unallocated amounts above include non-cash goodwill
impairment charges of $23.5 million and $32.4 million for the years ended December 31, 2010 and 2008, respectively, as
well as restructuring and other costs of $51.1 million, $26.6 million and $28.9 million for the years ended December 31,
2010, 2009 and 2008, respectively. Corporate and unallocated amounts above include a litigation settlement charge of
$2.6 million and $49.0 million for the years ended December 31, 2010 and 2009, respectively.
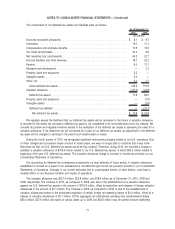
We have three major product categories: traditional storage, emerging storage, and electronics and accessories.
Traditional storage products include optical products, magnetic products and other traditional storage media products.
Optical products include primarily DVDs, CDs and Blu-ray disc recordable media. Magnetic products include primarily data
storage tape media. Other traditional storage products include primarily optical drives and audio and video tape media.
80
NOTES TO CONSOLIDATED FINANCIAL STATEMENTS — (Continued)