Memorex 2010 Annual Report Download - page 69
Download and view the complete annual report
Please find page 69 of the 2010 Memorex annual report below. You can navigate through the pages in the report by either clicking on the pages listed below, or by using the keyword search tool below to find specific information within the annual report.-
 1
1 -
2
-
3
-
4
-
5
-
6
-
7
-
8
-
9
-
10
-
11
-
12
-
13
-
14
-
15
-
16
-
17
-
18
-
19
-
20
-
21
-
22
-
23
-
24
-
25
-
26
-
27
-
28
-
29
-
30
-
31
-
32
-
33
-
34
-
35
-
36
-
37
-
38
-
39
-
40
-
41
-
42
-
43
-
44
-
45
-
46
-
47
-
48
-
49
-
50
-
51
-
52
-
53
-
54
-
55
-
56
-
57
-
58
-
 59
59 -
 60
60 -
 61
61 -
 62
62 -
 63
63 -
 64
64 -
 65
65 -
 66
66 -
 67
67 -
 68
68 -
 69
69 -
 70
70 -
 71
71 -
 72
72 -
 73
73 -
 74
74 -
 75
75 -
 76
76 -
 77
77 -
 78
78 -
 79
79 -
80
-
81
-
82
-
83
-
84
-
85
-
86
-
87
-
88
-
89
-
90
-
91
-
92
-
93
-
94
-
95
-
96
-
97
-
98
-
99
-
100
-
101
-
102
-
103
-
104
-
105
-
106
 |
 |

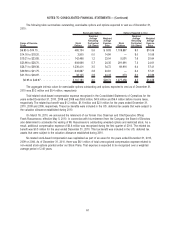
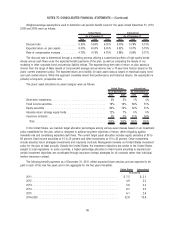
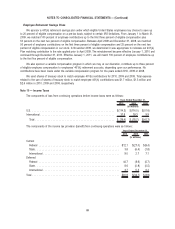
Weighted-average assumptions used to determine net periodic benefit costs for the years ended December 31, 2010,
2009 and 2008, were as follows:
2010 2009 2008 2010 2009 2008
As of December 31,
United States
As of December 31,
International
Discount rate . . . . . . . . . . . . . . . . . . . . . . 5.30% 5.60% 6.00% 5.00% 5.79% 5.13%
Expected return on plan assets . . . . . . . . . . 8.00% 8.00% 8.00% 5.52% 5.07% 5.73%
Rate of compensation increase . . . . . . . . . . 4.75% 4.75% 4.75% 2.98% 3.56% 3.77%
The discount rate is determined through a modeling process utilizing a customized portfolio of high-quality bonds
whose annual cash flows cover the expected benefit payments of the plan, as well as comparing the results of our
modeling to other corporate bond and pension liability indices. The expected long-term rate of return on plan assets is
chosen from the range of likely results of compounded average annual returns over a 10-year time horizon based on the
plans’ current investment policy. The expected return and volatility for each asset class is based on historical equity, bond
and cash market returns. While this approach considers recent fund performance and historical returns, the assumption is
primarily a long-term, prospective rate.
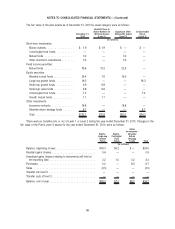
The plans’ asset allocations by asset category were as follows:
2010 2009 2010 2009
As of December 31,
United States
As of December 31,
International
Short-term investments. . . . . . . . . . . . . . . . . . . . . . . . . . . . . . . . . . . 3% 5% 1% 4%
Fixed income securities . . . . . . . . . . . . . . . . . . . . . . . . . . . . . . . . . . 19% 16% 36% 31%
Equity securities . . . . . . . . . . . . . . . . . . . . . . . . . . . . . . . . . . . . . . . 66% 72% 32% 31%
Absolute return strategy equity funds . . . . . . . . . . . . . . . . . . . . . . . . . 12% 7% 0% 0%
Insurance contracts . . . . . . . . . . . . . . . . . . . . . . . . . . . . . . . . . . . . . 0% 0% 31% 34%
Total. . . . . . . . . . . . . . . . . . . . . . . . . . . . . . . . . . . . . . . . . . . . . . 100% 100% 100% 100%
In the United States, we maintain target allocation percentages among various asset classes based on an investment
policy established for the plan, which is designed to achieve long-term objectives of return, while mitigating against
downside risk and considering expected cash flows. The current target asset allocation includes equity securities at 50 to
80 percent, fixed income securities at 15 to 25 percent and other investments at 10 to 20 percent. Other investments
include absolute return strategies investments and insurance contracts. Management reviews our United States investment
policy for the plan at least annually. Outside the United States, the investment objectives are similar to the United States,
subject to local regulations. In some countries, a higher percentage allocation to fixed income securities is required and
certain investment objectives are coordinated through insurance contract strategies for all contracts rather than individual
Imation insurance contract.
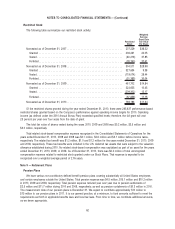
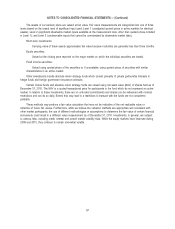
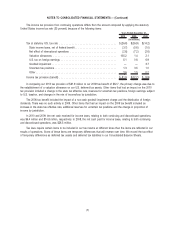
The following benefit payments as of December 31, 2010, reflect expected future services and are expected to be
paid in each of the next five years and in the aggregate for the five years thereafter:
United States International
(In millions)
2011 . . . . . . . . . . . . . . . . . . . . . . . . . . . . . . . . . . . . . . . . . . . . . . . . . . . . . . . $ 7.5 $ 2.1
2012 . . . . . . . . . . . . . . . . . . . . . . . . . . . . . . . . . . . . . . . . . . . . . . . . . . . . . . . 4.9 2.2
2013 . . . . . . . . . . . . . . . . . . . . . . . . . . . . . . . . . . . . . . . . . . . . . . . . . . . . . . . 5.8 2.4
2014 . . . . . . . . . . . . . . . . . . . . . . . . . . . . . . . . . . . . . . . . . . . . . . . . . . . . . . . 6.0 2.5
2015 . . . . . . . . . . . . . . . . . . . . . . . . . . . . . . . . . . . . . . . . . . . . . . . . . . . . . . . 6.1 2.6
2016-2020 . . . . . . . . . . . . . . . . . . . . . . . . . . . . . . . . . . . . . . . . . . . . . . . . . . . 32.8 15.8
66
NOTES TO CONSOLIDATED FINANCIAL STATEMENTS — (Continued)