Memorex 2010 Annual Report Download - page 41
Download and view the complete annual report
Please find page 41 of the 2010 Memorex annual report below. You can navigate through the pages in the report by either clicking on the pages listed below, or by using the keyword search tool below to find specific information within the annual report.-
 1
1 -
2
-
3
-
4
-
5
-
6
-
7
-
8
-
9
-
10
-
11
-
12
-
13
-
14
-
15
-
16
-
17
-
18
-
19
-
20
-
21
-
22
-
23
-
24
-
25
-
26
-
27
-
28
-
29
-
30
-
 31
31 -
 32
32 -
 33
33 -
 34
34 -
 35
35 -
 36
36 -
 37
37 -
 38
38 -
 39
39 -
 40
40 -
 41
41 -
 42
42 -
 43
43 -
 44
44 -
 45
45 -
 46
46 -
 47
47 -
 48
48 -
 49
49 -
 50
50 -
 51
51 -
52
-
53
-
54
-
55
-
56
-
57
-
58
-
59
-
60
-
61
-
62
-
63
-
64
-
65
-
66
-
67
-
68
-
69
-
70
-
71
-
72
-
73
-
74
-
75
-
76
-
77
-
78
-
79
-
80
-
81
-
82
-
83
-
84
-
85
-
86
-
87
-
88
-
89
-
90
-
91
-
92
-
93
-
94
-
95
-
96
-
97
-
98
-
99
-
100
-
101
-
102
-
103
-
104
-
105
-
106
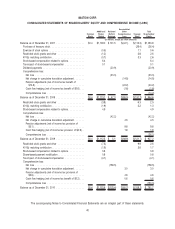
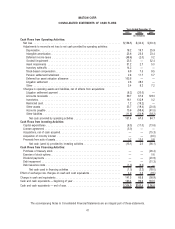
 |
 |

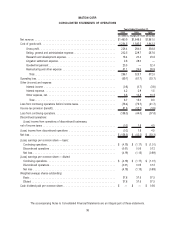
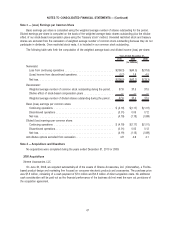
IMATION CORP.
CONSOLIDATED STATEMENTS OF OPERATIONS
2010 2009 2008
Years Ended December 31,
(In millions, except per share amounts)
Net revenue . . . . . . . . . . . . . . . . . . . . . . . . . . . . . . . . . . . . . . . . . . . . . . . . . . . . $1,460.9 $1,649.5 $1,981.0
Cost of goods sold. . . . . . . . . . . . . . . . . . . . . . . . . . . . . . . . . . . . . . . . . . . . . . . . 1,234.5 1,385.5 1,642.2
Gross profit . . . . . . . . . . . . . . . . . . . . . . . . . . . . . . . . . . . . . . . . . . . . . . . . . 226.4 264.0 338.8
Selling, general and administrative expense . . . . . . . . . . . . . . . . . . . . . . . . . . . 202.5 229.7 287.6
Research and development expense. . . . . . . . . . . . . . . . . . . . . . . . . . . . . . . . 16.4 20.4 23.6
Litigation settlement expense . . . . . . . . . . . . . . . . . . . . . . . . . . . . . . . . . . . . . 2.6 49.0 —
Goodwill impairment . . . . . . . . . . . . . . . . . . . . . . . . . . . . . . . . . . . . . . . . . . . 23.5 — 32.4
Restructuring and other expense . . . . . . . . . . . . . . . . . . . . . . . . . . . . . . . . . . 51.1 26.6 28.9
Total . . . . . . . . . . . . . . . . . . . . . . . . . . . . . . . . . . . . . . . . . . . . . . . . . . . . 296.1 325.7 372.5
Operating loss . . . . . . . . . . . . . . . . . . . . . . . . . . . . . . . . . . . . . . . . . . . . . . . . . . . (69.7) (61.7) (33.7)
Other (income) and expense
Interest income . . . . . . . . . . . . . . . . . . . . . . . . . . . . . . . . . . . . . . . . . . . . . . (0.8) (0.7) (3.8)
Interest expense. . . . . . . . . . . . . . . . . . . . . . . . . . . . . . . . . . . . . . . . . . . . . . 4.2 2.9 1.5
Other expense, net . . . . . . . . . . . . . . . . . . . . . . . . . . . . . . . . . . . . . . . . . . . . 3.3 12.8 10.3
Total . . . . . . . . . . . . . . . . . . . . . . . . . . . . . . . . . . . . . . . . . . . . . . . . . . . . 6.7 15.0 8.0
Loss from continuing operations before income taxes . . . . . . . . . . . . . . . . . . . . . . . . (76.4) (76.7) (41.7)
Income tax provision (benefit) . . . . . . . . . . . . . . . . . . . . . . . . . . . . . . . . . . . . . . . . 81.9 (32.7) (3.9)
Loss from continuing operations. . . . . . . . . . . . . . . . . . . . . . . . . . . . . . . . . . . . . . . (158.3) (44.0) (37.8)
Discontinued operations:
(Loss) income from operations of discontinued businesses,
net of income taxes . . . . . . . . . . . . . . . . . . . . . . . . . . . . . . . . . . . . . . . . . . . . . . . (0.2) 1.8 4.5
(Loss) income from discontinued operations . . . . . . . . . . . . . . . . . . . . . . . . . . . . . . (0.2) 1.8 4.5
Net loss . . . . . . . . . . . . . . . . . . . . . . . . . . . . . . . . . . . . . . . . . . . . . . . . . . . . . . . $ (158.5) $ (42.2) $ (33.3)
(Loss) earnings per common share — basic:
Continuing operations . . . . . . . . . . . . . . . . . . . . . . . . . . . . . . . . . . . . . . . . . . . . $ (4.19) $ (1.17) $ (1.01)
Discontinued operations . . . . . . . . . . . . . . . . . . . . . . . . . . . . . . . . . . . . . . . . . . (0.01) 0.05 0.12
Net loss . . . . . . . . . . . . . . . . . . . . . . . . . . . . . . . . . . . . . . . . . . . . . . . . . . . . . (4.19) (1.13) (0.89)
(Loss) earnings per common share — diluted:
Continuing operations . . . . . . . . . . . . . . . . . . . . . . . . . . . . . . . . . . . . . . . . . . . . $ (4.19) $ (1.17) $ (1.01)
Discontinued operations . . . . . . . . . . . . . . . . . . . . . . . . . . . . . . . . . . . . . . . . . . (0.01) 0.05 0.12
Net loss . . . . . . . . . . . . . . . . . . . . . . . . . . . . . . . . . . . . . . . . . . . . . . . . . . . . . (4.19) (1.13) (0.89)
Weighted average shares outstanding:
Basic . . . . . . . . . . . . . . . . . . . . . . . . . . . . . . . . . . . . . . . . . . . . . . . . . . . . . . . 37.8 37.5 37.5
Diluted . . . . . . . . . . . . . . . . . . . . . . . . . . . . . . . . . . . . . . . . . . . . . . . . . . . . . . 37.8 37.5 37.5
Cash dividend paid per common share . . . . . . . . . . . . . . . . . . . . . . . . . . . . . . . . . . $ — $ — $ 0.56
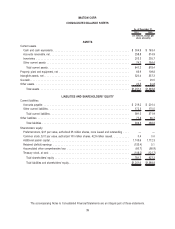
The accompanying Notes to Consolidated Financial Statements are an integral part of these statements.
38