Memorex 2010 Annual Report Download - page 27
Download and view the complete annual report
Please find page 27 of the 2010 Memorex annual report below. You can navigate through the pages in the report by either clicking on the pages listed below, or by using the keyword search tool below to find specific information within the annual report.-
 1
1 -
2
-
3
-
4
-
5
-
6
-
7
-
8
-
9
-
10
-
11
-
12
-
13
-
14
-
15
-
16
-
 17
17 -
 18
18 -
 19
19 -
 20
20 -
 21
21 -
 22
22 -
 23
23 -
 24
24 -
 25
25 -
 26
26 -
 27
27 -
 28
28 -
 29
29 -
 30
30 -
 31
31 -
 32
32 -
 33
33 -
 34
34 -
 35
35 -
 36
36 -
 37
37 -
38
-
39
-
40
-
41
-
42
-
43
-
44
-
45
-
46
-
47
-
48
-
49
-
50
-
51
-
52
-
53
-
54
-
55
-
56
-
57
-
58
-
59
-
60
-
61
-
62
-
63
-
64
-
65
-
66
-
67
-
68
-
69
-
70
-
71
-
72
-
73
-
74
-
75
-
76
-
77
-
78
-
79
-
80
-
81
-
82
-
83
-
84
-
85
-
86
-
87
-
88
-
89
-
90
-
91
-
92
-
93
-
94
-
95
-
96
-
97
-
98
-
99
-
100
-
101
-
102
-
103
-
104
-
105
-
106
 |
 |

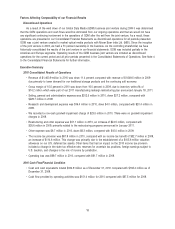
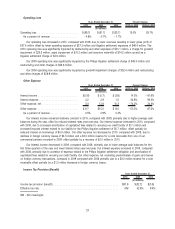
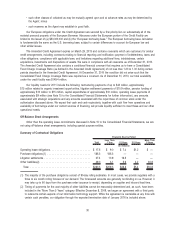
The change in our effective rate for 2010, as compared to 2009, was primarily due to the establishment of a
valuation allowance on our U.S. deferred tax assets. During the fourth quarter of 2010, we recognized significant
restructuring charges related to our U.S. operations. Due to these charges and cumulative losses incurred in recent years,
we were no longer able to conclude that it was more-likely-than-not that our U.S. deferred tax assets would be fully
realized. Therefore, during 2010, we recorded a charge to establish a valuation allowance of $105.6 million related to our
U.S. deferred tax assets. The valuation allowance charge is included in income tax provision on our Consolidated
Statement of Operations.
Other items that had an impact on the 2010 effective tax rate included a change in the state tax effective rate,
reserves for uncertain tax positions, foreign earnings subject to U.S. taxation, and changes in the mix of income by
jurisdiction. See Note 10 to the Consolidated Financial Statements for further information.
The uncharacteristically low effective tax rate in 2008 was due to permanent differences for tax purposes including a
non-cash goodwill impairment charge and the payment of dividends treated as a return of capital. There was no such
activity in 2009 and, as a result, the effective tax rate is much closer to the statutory rate. Other items that have an
impact on the 2009 effective tax rate include an increase in the state tax effective rate, additional reserves for uncertain
tax positions and the change in proportion of income by jurisdiction.
As of December 31, 2010 and 2009 we had valuation allowances of $127.4 million and $22.9 million, respectively, to
account for deferred tax assets we have concluded are not considered to be more-likely-than-not to be realized in the
future due to our cumulative losses in recent years. The deferred tax assets subject to valuation allowance include certain
U.S. and foreign operating loss carryforwards, certain U.S. deferred tax deductions, and certain tax credit carryforwards.
Segment Results
During the second quarter of 2010, we realigned our corporate segments and reporting structure with how the
business is managed. As part of this reorganization, we combined our Electronic Products segment with our Americas
segment, and we separated our Asia Pacific segment into North Asia and South Asia regions. Each of these segments
has responsibility for selling all of our product lines.
• Our Americas segment includes North America, Central America and South America.
• Our Europe segment includes Europe and parts of Africa.
• Our North Asia segment includes Japan, China, Hong Kong, Korea and Taiwan.
• Our South Asia segment includes Australia, Singapore, India, the Middle East and parts of Africa.
We revised the segment information for the prior year within this Form 10-K to conform to the new presentation. We
evaluate segment performance based on revenue and operating income. Revenue for each segment is generally based on
customer location where the product is shipped. The operating income reported in our segments excludes corporate and
other unallocated amounts. Although such amounts are excluded from the business segment results, they are included in
reported consolidated earnings. Corporate and unallocated amounts include litigation settlement expense, goodwill
impairment expense, research and development expense, corporate expense, stock-based compensation expense and
restructuring and other expenses which are not allocated to the segments.
Information related to our segments is as follows:
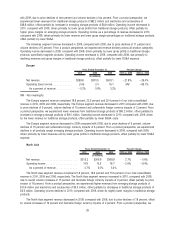
Americas
2010 2009 2008 2010 vs. 2009 2009 vs. 2008
Years Ended December 31, Percent Change
(In millions)
Net revenue . . . . . . . . . . . . . . . . . . . . . . . . . . . . $712.9 $834.2 $1,002.9 ⫺14.5% ⫺16.8%
Operating income . . . . . . . . . . . . . . . . . . . . . . . . 36.8 48.3 58.1 ⫺23.8% ⫺16.9%
As a percent of revenue . . . . . . . . . . . . . . . . . . 5.2% 5.8% 5.8%
The Americas segment was our largest segment comprising 48.8 percent, 50.6 percent and 50.6 percent of our total
consolidated revenue in 2010, 2009 and 2008, respectively. The Americas segment revenue decreased in 2010, compared
24