Memorex 2010 Annual Report Download - page 70
Download and view the complete annual report
Please find page 70 of the 2010 Memorex annual report below. You can navigate through the pages in the report by either clicking on the pages listed below, or by using the keyword search tool below to find specific information within the annual report.-
 1
1 -
2
-
3
-
4
-
5
-
6
-
7
-
8
-
9
-
10
-
11
-
12
-
13
-
14
-
15
-
16
-
17
-
18
-
19
-
20
-
21
-
22
-
23
-
24
-
25
-
26
-
27
-
28
-
29
-
30
-
31
-
32
-
33
-
34
-
35
-
36
-
37
-
38
-
39
-
40
-
41
-
42
-
43
-
44
-
45
-
46
-
47
-
48
-
49
-
50
-
51
-
52
-
53
-
54
-
55
-
56
-
57
-
58
-
59
-
 60
60 -
 61
61 -
 62
62 -
 63
63 -
 64
64 -
 65
65 -
 66
66 -
 67
67 -
 68
68 -
 69
69 -
 70
70 -
 71
71 -
 72
72 -
 73
73 -
 74
74 -
 75
75 -
 76
76 -
 77
77 -
 78
78 -
 79
79 -
 80
80 -
81
-
82
-
83
-
84
-
85
-
86
-
87
-
88
-
89
-
90
-
91
-
92
-
93
-
94
-
95
-
96
-
97
-
98
-
99
-
100
-
101
-
102
-
103
-
104
-
105
-
106
 |
 |
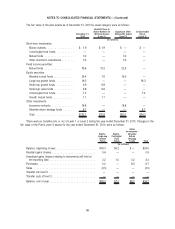
The assets of our pension plans are valued at fair value. Fair value measurements are categorized into one of three
levels based on the lowest level of significant input used: Level 1 (unadjusted quoted prices in active markets for identical
assets); Level 2 (significant observable market inputs available at the measurement date, other than quoted prices included
in Level 1); and Level 3 (unobservable inputs that cannot be corroborated by observable market data).
Short-term investments:
Carrying value of these assets approximates fair value because maturities are generally less than three months.
Equity securities:
Valued at the closing price reported on the major market on which the individual securities are traded.
Fixed income securities:
Valued using quoted prices of the securities or, if unavailable, using quoted prices of securities with similar
characteristics in an active market.
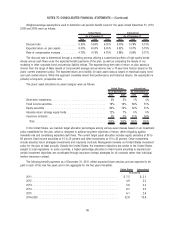
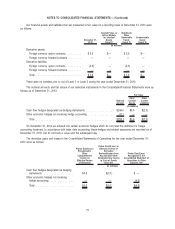
Other investments include absolute return strategy funds which consist primarily of private partnership interests in
hedge funds and foreign government insurance contracts.
Certain mutual funds and absolute return strategy funds are valued using net asset value (NAV) of shares held as of
December 31, 2010. The NAV is a quoted transactional price for participants in the fund which do not represent an active
market. In relation to these investments, there are no unfunded commitments and shares can be redeemed with minimal
restrictions and can do so daily. Events that may lead to a restriction to transact with the funds are not considered
probable.
These methods may produce a fair value calculation that may not be indicative of the net realizable value or
reflective of future fair values. Furthermore, while we believe the valuation methods are appropriate and consistent with
other market participants, the use of different methodologies or assumptions to determine the fair value of certain financial
instruments could result in a different value measurement as of December 31, 2010. Investments, in general, are subject
to various risks, including credit, interest and overall market volatility risks. While the equity markets have improved during
2009 and 2010, they continue to remain somewhat volatile.
67
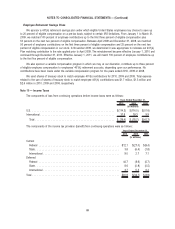
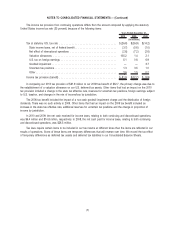
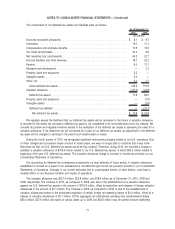
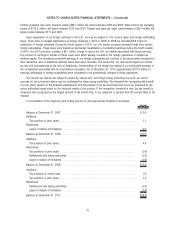
NOTES TO CONSOLIDATED FINANCIAL STATEMENTS — (Continued)