Memorex 2010 Annual Report Download - page 63
Download and view the complete annual report
Please find page 63 of the 2010 Memorex annual report below. You can navigate through the pages in the report by either clicking on the pages listed below, or by using the keyword search tool below to find specific information within the annual report.-
 1
1 -
2
-
3
-
4
-
5
-
6
-
7
-
8
-
9
-
10
-
11
-
12
-
13
-
14
-
15
-
16
-
17
-
18
-
19
-
20
-
21
-
22
-
23
-
24
-
25
-
26
-
27
-
28
-
29
-
30
-
31
-
32
-
33
-
34
-
35
-
36
-
37
-
38
-
39
-
40
-
41
-
42
-
43
-
44
-
45
-
46
-
47
-
48
-
49
-
50
-
51
-
52
-
 53
53 -
 54
54 -
 55
55 -
 56
56 -
 57
57 -
 58
58 -
 59
59 -
 60
60 -
 61
61 -
 62
62 -
 63
63 -
 64
64 -
 65
65 -
 66
66 -
 67
67 -
 68
68 -
 69
69 -
 70
70 -
 71
71 -
 72
72 -
 73
73 -
74
-
75
-
76
-
77
-
78
-
79
-
80
-
81
-
82
-
83
-
84
-
85
-
86
-
87
-
88
-
89
-
90
-
91
-
92
-
93
-
94
-
95
-
96
-
97
-
98
-
99
-
100
-
101
-
102
-
103
-
104
-
105
-
106
 |
 |

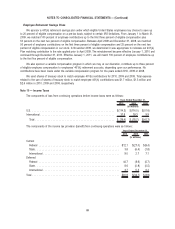
awards, the contractual term of the awards, historical average holding periods, stock price history, impacts from recent
restructuring initiatives and the relative weight for each of these factors. The dividend yield was based on the latest
dividend payments made on or announced by the date of the grant.
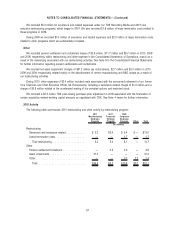
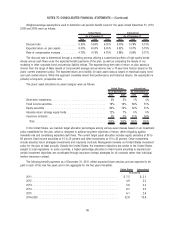
The following table summarizes our weighted average assumptions used in the valuation of options for the years
ended December 31:
2010 2009 2008
Volatility . . . . . . . . . . . . . . . . . . . . . . . . . . . . . . . . . . . . . . . . . . . . . . . . . . . . . . . . 43% 41% 31%
Risk-free interest rate . . . . . . . . . . . . . . . . . . . . . . . . . . . . . . . . . . . . . . . . . . . . . . . 2.49% 2.13% 3.04%
Expected life (months) . . . . . . . . . . . . . . . . . . . . . . . . . . . . . . . . . . . . . . . . . . . . . . 66 65 61
Dividend yield . . . . . . . . . . . . . . . . . . . . . . . . . . . . . . . . . . . . . . . . . . . . . . . . . . . . 0.0% 0.0% 2.6%
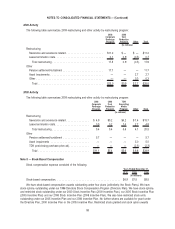
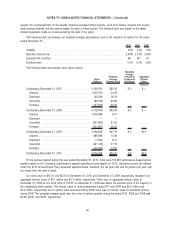
The following table summarizes stock option activity:
Stock
Options
Weighted
Average
Exercise Price
Weighted
Average
Remaining
Contractual
Life (Years)
Aggregate
Intrinsic
Value
(millions)
Outstanding December 31, 2007 . . . . . . . . . . . . . . . . . 3,149,761 $35.16 6.0 $ —
Granted. . . . . . . . . . . . . . . . . . . . . . . . . . . . . . . . . 1,237,513 24.39
Exercised . . . . . . . . . . . . . . . . . . . . . . . . . . . . . . . (46,330) 18.33
Cancelled . . . . . . . . . . . . . . . . . . . . . . . . . . . . . . . (89,315) 35.98
Forfeited . . . . . . . . . . . . . . . . . . . . . . . . . . . . . . . . (147,873) 35.32
Outstanding December 31, 2008 . . . . . . . . . . . . . . . . . 4,103,756 $32.09 6.2 $ —
Granted. . . . . . . . . . . . . . . . . . . . . . . . . . . . . . . . . 1,054,599 9.71
Exercised . . . . . . . . . . . . . . . . . . . . . . . . . . . . . . . — —
Cancelled . . . . . . . . . . . . . . . . . . . . . . . . . . . . . . . (341,850) 31.25
Forfeited . . . . . . . . . . . . . . . . . . . . . . . . . . . . . . . . (221,667) 28.32
Outstanding December 31, 2009 . . . . . . . . . . . . . . . . . 4,594,838 $27.19 6.2 $0.1
Granted. . . . . . . . . . . . . . . . . . . . . . . . . . . . . . . . . 889,089 10.46
Exercised . . . . . . . . . . . . . . . . . . . . . . . . . . . . . . . (1,000) 8.11
Cancelled . . . . . . . . . . . . . . . . . . . . . . . . . . . . . . . (421,146) 31.19
Forfeited . . . . . . . . . . . . . . . . . . . . . . . . . . . . . . . . (145,693) 17.97
Outstanding December 31, 2010 . . . . . . . . . . . . . . . . . 4,916,088 $24.10 5.6 $0.7
Of the options granted during the year ended December 31, 2010, there were 105,397 performance-based options
granted based on the Company’s performance against operating income targets for 2010. Operating income (as defined
under the 2010 Annual Bonus Plan) exceeded specified levels; therefore, the full grant will vest 25 percent per year over
four years from the date of grant.
Our stock price of $10.31 and $8.72 on December 31, 2010 and December, 31, 2009, respectively, resulted in an
aggregate intrinsic value of $0.7 million and $0.1 million, respectively. There was no aggregate intrinsic value at
December 31, 2008 as our stock price of $13.57 on December 31, 2008 was below the exercise price of the majority of
the outstanding stock options. The intrinsic value of options exercised during 2010 and 2008 was $0.0 million and
$0.3 million, respectively. As no options were exercised during 2009, there was no intrinsic value for exercised options
during 2009. The weighted average grant date fair value of options granted during the years 2010, 2009 and 2008 was
$4.46, $3.94, and $5.97, respectively.
60
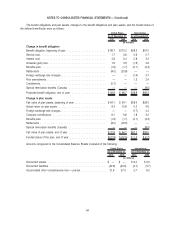
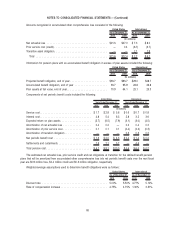
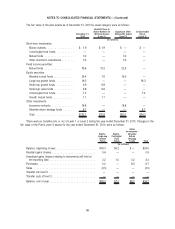
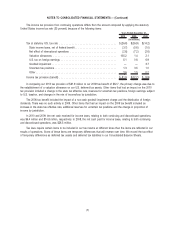
NOTES TO CONSOLIDATED FINANCIAL STATEMENTS — (Continued)