Memorex 2010 Annual Report Download - page 22
Download and view the complete annual report
Please find page 22 of the 2010 Memorex annual report below. You can navigate through the pages in the report by either clicking on the pages listed below, or by using the keyword search tool below to find specific information within the annual report.-
 1
1 -
2
-
3
-
4
-
5
-
6
-
7
-
8
-
9
-
10
-
11
-
 12
12 -
 13
13 -
 14
14 -
 15
15 -
 16
16 -
 17
17 -
 18
18 -
 19
19 -
 20
20 -
 21
21 -
 22
22 -
 23
23 -
 24
24 -
 25
25 -
 26
26 -
 27
27 -
 28
28 -
 29
29 -
 30
30 -
 31
31 -
 32
32 -
33
-
34
-
35
-
36
-
37
-
38
-
39
-
40
-
41
-
42
-
43
-
44
-
45
-
46
-
47
-
48
-
49
-
50
-
51
-
52
-
53
-
54
-
55
-
56
-
57
-
58
-
59
-
60
-
61
-
62
-
63
-
64
-
65
-
66
-
67
-
68
-
69
-
70
-
71
-
72
-
73
-
74
-
75
-
76
-
77
-
78
-
79
-
80
-
81
-
82
-
83
-
84
-
85
-
86
-
87
-
88
-
89
-
90
-
91
-
92
-
93
-
94
-
95
-
96
-
97
-
98
-
99
-
100
-
101
-
102
-
103
-
104
-
105
-
106
 |
 |

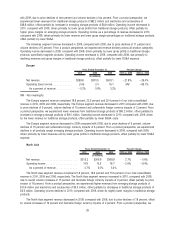
Results of Operations
Net Revenue
2010 2009 2008
2010 vs.
2009
2009 vs.
2008
Years Ended December 31,
Percent Change
(In millions)
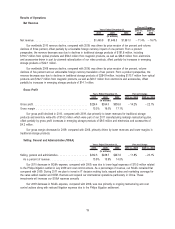
Net revenue . . . . . . . . . . . . . . . . . . . . . . . . . . . . . . . . . . . . . $1,460.9 $1,649.5 $1,981.0 ⫺11.4% ⫺16.7%
Our worldwide 2010 revenue decline, compared with 2009, was driven by price erosion of ten percent and volume
declines of three percent, offset partially by a favorable foreign currency impact of one percent. From a product
perspective, the revenue decrease was due to declines in traditional storage products of $191.8 million, including
$118.7 million from optical products and $58.2 million from magnetic products, as well as $38.9 million from electronics
and accessories driven in part by planned rationalization of our video products, offset partially by increases in emerging
storage products of $42.1 million.
Our worldwide 2009 revenue decline, compared with 2008, was driven by price erosion of ten percent, volume
declines of five percent and an unfavorable foreign currency translation of two percent. From a product perspective, the
revenue decrease was due to declines in traditional storage products of $284.9 million, including $113.7 million from optical
products and $142.7 million from magnetic products, as well as $60.7 million from electronics and accessories, offset
partially by increases in emerging storage products of $14.1 million.
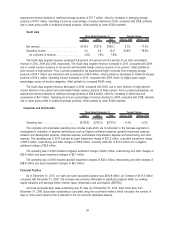
Gross Profit
2010 2009 2008 2010 vs. 2009 2009 vs. 2008
Years Ended December 31, Percent Change
(In millions)
Gross profit . . . . . . . . . . . . . . . . . . . . . . . . . . . . . . . . . . . $226.4 $264.0 $338.8 ⫺14.2% ⫺22.1%
Gross margin . . . . . . . . . . . . . . . . . . . . . . . . . . . . . . . . . 15.5% 16.0% 17.1%
Our gross profit declined in 2010, compared with 2009, due primarily to lower revenues for traditional storage
products and inventory write-offs of $14.2 million which were part of our 2011 manufacturing redesign restructuring plan,
offset partially by gross profit increases in emerging storage products of $9.5 million and electronics and accessories of
$4.2 million.
Our gross margin decreased in 2009, compared with 2008, primarily driven by lower revenues and lower margins in
traditional storage products.
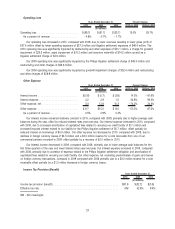
Selling, General and Administrative (SG&A)
2010 2009 2008 2010 vs. 2009 2009 vs. 2008
Years Ended December 31, Percent Change
(In millions)
Selling, general and administrative . . . . . . . . . . . . . . . . . . . $202.5 $229.7 $287.6 ⫺11.8% ⫺20.1%
As a percent of revenue . . . . . . . . . . . . . . . . . . . . . . . . 13.9% 13.9% 14.5%
Our 2010 decrease in SG&A expense, compared with 2009, was due to lower legal expenses of $10.5 million related
to the Philips litigation settled in July 2009 and cost control actions. As a percentage of revenue, our SG&A remained flat
compared with 2009. During 2011 we plan to invest in IT decision making tools, expand sales and marketing coverage for
the value added reseller and OEM channels and expand our international operations particularly in China. These
investments will increase our SG&A expense annually.
Our 2009 decrease in SG&A expense, compared with 2008, was due primarily to ongoing restructuring and cost
control actions along with reduced litigation expense due to the Philips litigation settlement.
19