Memorex 2010 Annual Report Download - page 7
Download and view the complete annual report
Please find page 7 of the 2010 Memorex annual report below. You can navigate through the pages in the report by either clicking on the pages listed below, or by using the keyword search tool below to find specific information within the annual report.-
 1
1 -
 2
2 -
 3
3 -
 4
4 -
 5
5 -
 6
6 -
 7
7 -
 8
8 -
 9
9 -
 10
10 -
 11
11 -
 12
12 -
 13
13 -
 14
14 -
 15
15 -
 16
16 -
 17
17 -
 18
18 -
19
-
20
-
21
-
22
-
23
-
24
-
25
-
26
-
27
-
28
-
29
-
30
-
31
-
32
-
33
-
34
-
35
-
36
-
37
-
38
-
39
-
40
-
41
-
42
-
43
-
44
-
45
-
46
-
47
-
48
-
49
-
50
-
51
-
52
-
53
-
54
-
55
-
56
-
57
-
58
-
59
-
60
-
61
-
62
-
63
-
64
-
65
-
66
-
67
-
68
-
69
-
70
-
71
-
72
-
73
-
74
-
75
-
76
-
77
-
78
-
79
-
80
-
81
-
82
-
83
-
84
-
85
-
86
-
87
-
88
-
89
-
90
-
91
-
92
-
93
-
94
-
95
-
96
-
97
-
98
-
99
-
100
-
101
-
102
-
103
-
104
-
105
-
106
 |
 |
The XtremeMac brand was acquired by Imation in 2008. XtremeMac brand products include cases, chargers and
audio solutions to protect, power and play Apple iPad, iPod, iPhone and other devices. XtremeMac products are developed
for Apple enthusiasts and are available worldwide.
Business Segments
Our business is organized, managed and internally and externally reported as segments differentiated by the regional
markets we serve: Americas, Europe, North Asia and South Asia. Each of these geographic segments has responsibility
for selling all of our product lines.
The Americas segment, our largest segment by revenue, includes North America, Central America and South America.
The United States represents the largest current market for our products. It has a great variety and sophistication of
distribution channels including value-added resellers, OEMs, retail outlets, mass merchants and on-line resellers. The countries
in South America and the Caribbean represent potential growth markets with increasing penetration of Information Technology
(IT) in the commercial and consumer markets.
The Europe segment includes Europe and parts of Africa. Western Europe exhibits traits similar to North America in
terms of overall breadth of product offerings, high penetration of end user markets and breadth and sophistication of
distribution channels. Emerging markets in Eastern Europe represent potential growth markets for our products as IT end
user and consumer markets grow.
North Asia is our second largest segment by revenue, and includes Japan, China, Hong Kong, Korea and Taiwan. It
has the widest diversity of languages, cultures and currencies of any of our segments. Japan is the single largest market
in the segment and is similar to North America and Western Europe in terms of overall penetration of IT into the market,
though its distribution channels are less developed than those of other regions.
The South Asia segment includes Australia, Singapore, India, the Middle East and parts of Africa. It also has a wide
diversity of languages, cultures and currencies and is similar to North America and Western Europe in terms of overall
penetration of IT into the market, though its distribution channels are less developed.
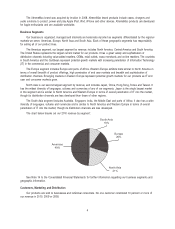
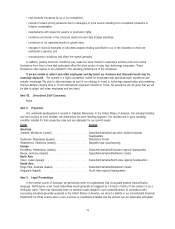
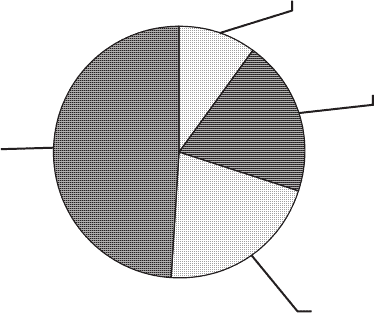
The chart below breaks out our 2010 revenue by segment:
South Asia
10%
A
mericas
49%
Europe
20%
North Asia
21%
See Note 14 to the Consolidated Financial Statements for further information regarding our business segments and
geographic information.
Customers, Marketing and Distribution
Our products are sold to businesses and individual consumers. No one customer constituted 10 percent or more of
our revenue in 2010, 2009 or 2008.
4