Lululemon 2013 Annual Report Download - page 65
Download and view the complete annual report
Please find page 65 of the 2013 Lululemon annual report below. You can navigate through the pages in the report by either clicking on the pages listed below, or by using the keyword search tool below to find specific information within the annual report.-
 1
1 -
2
-
3
-
4
-
5
-
6
-
7
-
8
-
9
-
10
-
11
-
12
-
13
-
14
-
15
-
16
-
17
-
18
-
19
-
20
-
21
-
22
-
23
-
24
-
25
-
26
-
27
-
28
-
29
-
30
-
31
-
32
-
33
-
34
-
35
-
36
-
37
-
38
-
39
-
40
-
41
-
42
-
43
-
44
-
45
-
46
-
47
-
48
-
49
-
50
-
51
-
52
-
53
-
54
-
 55
55 -
 56
56 -
 57
57 -
 58
58 -
 59
59 -
 60
60 -
 61
61 -
 62
62 -
 63
63 -
 64
64 -
 65
65 -
 66
66 -
 67
67 -
 68
68 -
 69
69 -
 70
70 -
 71
71 -
 72
72 -
 73
73 -
 74
74 -
 75
75 -
76
-
77
-
78
-
79
-
80
-
81
-
82
-
83
-
84
-
85
-
86
-
87
-
88
-
89
-
90
-
91
-
92
-
93
-
94
-
95
-
96
-
97
-
98
-
99
-
100
-
101
-
102
-
103
-
104
-
105
-
106
-
107
-
108
-
109
 |
 |

Table of Contents
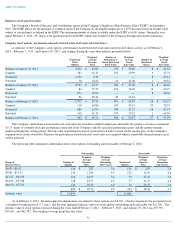
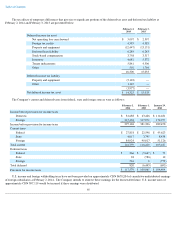
The Company operates in five geographic areas—Canada, the United States, Australia and New Zealand, Asia and Europe. Revenue from
these regions for the years ended February 2, 2014 , February 3, 2013 , and January 29, 2012 was as follows:
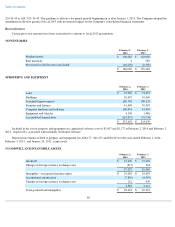
Long-lived assets by geographic area for the years ended February 2, 2014 and February 3, 2013 were as follows:
Substantially all of the Company's intangible assets and goodwill relate to the reporting segment consisting of corporate-owned stores.
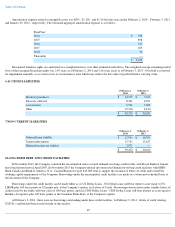
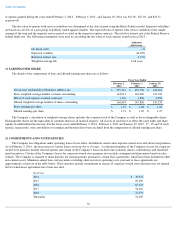
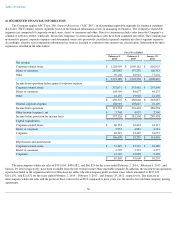
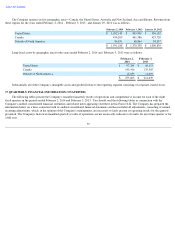
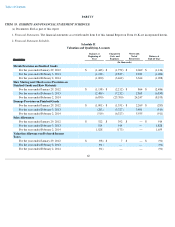
17 QUARTERLY FINANCIAL INFORMATION (UNAUDITED)
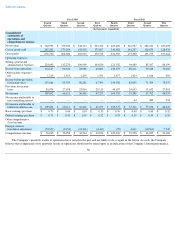
The following tables present the Company's unaudited quarterly results of operations and comprehensive income for each of the eight
fiscal quarters in the periods ended February 2, 2014 and February 3, 2013 . You should read the following tables in conjunction with the
Company's audited consolidated financial statements and related notes appearing elsewhere in this Form 10-K. The Company has prepared the
information below on a basis consistent with its audited consolidated financial statements and has included all adjustments, consisting of normal
recurring adjustments, which, in the opinion of the Company's management, are necessary to fairly present its operating results for the quarters
presented. The Company's historical unaudited quarterly results of operations are not necessarily indicative of results for any future quarter or for
a full year.
57
February 2, 2014
February 3, 2013
January 29, 2012
United States
$
1,052,148
$
839,908
$
536,182
Canada
454,209
461,586
425,720
Outside of North America
84,831
68,864
38,937
$
1,591,188
$
1,370,358
$
1,000,839
February 2,
2014
February 3,
2013
United States
$
97,288
$
68,115
Canada
145,416
135,505
Outside of North America
12,899
11,019
$
255,603
$
214,639