Lululemon 2013 Annual Report Download - page 29
Download and view the complete annual report
Please find page 29 of the 2013 Lululemon annual report below. You can navigate through the pages in the report by either clicking on the pages listed below, or by using the keyword search tool below to find specific information within the annual report.-
 1
1 -
2
-
3
-
4
-
5
-
6
-
7
-
8
-
9
-
10
-
11
-
12
-
13
-
14
-
15
-
16
-
17
-
18
-
 19
19 -
 20
20 -
 21
21 -
 22
22 -
 23
23 -
 24
24 -
 25
25 -
 26
26 -
 27
27 -
 28
28 -
 29
29 -
 30
30 -
 31
31 -
 32
32 -
 33
33 -
 34
34 -
 35
35 -
 36
36 -
 37
37 -
 38
38 -
 39
39 -
40
-
41
-
42
-
43
-
44
-
45
-
46
-
47
-
48
-
49
-
50
-
51
-
52
-
53
-
54
-
55
-
56
-
57
-
58
-
59
-
60
-
61
-
62
-
63
-
64
-
65
-
66
-
67
-
68
-
69
-
70
-
71
-
72
-
73
-
74
-
75
-
76
-
77
-
78
-
79
-
80
-
81
-
82
-
83
-
84
-
85
-
86
-
87
-
88
-
89
-
90
-
91
-
92
-
93
-
94
-
95
-
96
-
97
-
98
-
99
-
100
-
101
-
102
-
103
-
104
-
105
-
106
-
107
-
108
-
109
 |
 |

Table of Contents
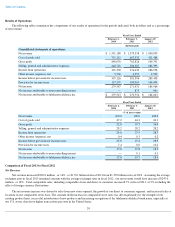
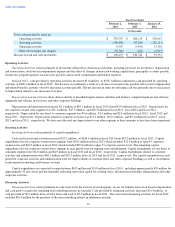
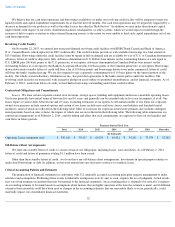
Results of Operations
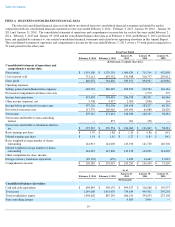
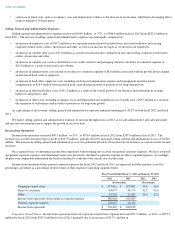
The following tables summarize key components of our results of operations for the periods indicated, both in dollars and as a percentage
of net revenue:
Comparison of Fiscal 2013 to Fiscal 2012
Net Revenue
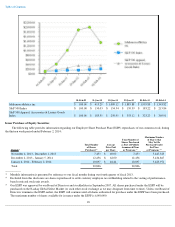
Net revenue increased $220.8 million , or 16% , to $1.591 billion in fiscal 2013 from $1.370 billion in fiscal 2012 . Assuming the average
exchange rates in fiscal 2013 remained constant with the average exchange rates in fiscal 2012 , our net revenue would have increase d $247.0
million , or 18% . Total comparable sales, including comparable stores and direct to consumer, increased 7% in fiscal 2013, or 9% excluding the
effect of foreign currency fluctuations.
The net revenue increase
was driven by sales from new stores opened, the growth of our direct to consumer segment, and increased sales at
locations in our comparable stores base. The constant dollar increase in comparable store sales was driven primarily by the strength of our
existing product lines, successful introduction of new products and increasing recognition of the lululemon athletica brand name, especially at
our U.S. stores, that drove higher transactions per store in the United States.
24
Fiscal Year Ended
February 2,
2014
February 3,
2013
January 29,
2012
(In thousands)
Consolidated statements of operations:
Net revenue
$
1,591,188
$
1,370,358
$
1,000,839
Cost of goods sold
751,112
607,532
431,488
Gross profit
840,076
762,826
569,351
Selling, general and administrative expenses
448,718
386,387
282,393
Income from operations
391,358
376,439
286,958
Other income (expense), net
5,768
4,957
2,500
Income before provision for income taxes
397,126
381,396
289,458
Provision for income taxes
117,579
109,965
104,494
Net income
279,547
271,431
184,964
Net income attributable to non-controlling interest
—
875
901
Net income attributable to lululemon athletica inc.
$
279,547
$
270,556
$
184,063
Fiscal Year Ended
February 2,
2014
February 3,
2013
January 29,
2012
(% of net revenue)
Net revenue
100.0
100.0
100.0
Cost of goods sold
47.2
44.3
43.1
Gross profit
52.8
55.7
56.9
Selling, general and administrative expenses
28.2
28.2
28.2
Income from operations
24.6
27.5
28.7
Other income (expense), net
0.4
0.3
0.2
Income before provision for income taxes
25.0
27.8
28.9
Provision for income taxes
7.4
8.0
10.4
Net income
17.6
19.8
18.5
Net income attributable to non-controlling interest
—
0.1
0.1
Net income attributable to lululemon athletica inc.
17.6
19.7
18.4