Lululemon 2013 Annual Report Download - page 30
Download and view the complete annual report
Please find page 30 of the 2013 Lululemon annual report below. You can navigate through the pages in the report by either clicking on the pages listed below, or by using the keyword search tool below to find specific information within the annual report.-
 1
1 -
2
-
3
-
4
-
5
-
6
-
7
-
8
-
9
-
10
-
11
-
12
-
13
-
14
-
15
-
16
-
17
-
18
-
19
-
 20
20 -
 21
21 -
 22
22 -
 23
23 -
 24
24 -
 25
25 -
 26
26 -
 27
27 -
 28
28 -
 29
29 -
 30
30 -
 31
31 -
 32
32 -
 33
33 -
 34
34 -
 35
35 -
 36
36 -
 37
37 -
 38
38 -
 39
39 -
 40
40 -
41
-
42
-
43
-
44
-
45
-
46
-
47
-
48
-
49
-
50
-
51
-
52
-
53
-
54
-
55
-
56
-
57
-
58
-
59
-
60
-
61
-
62
-
63
-
64
-
65
-
66
-
67
-
68
-
69
-
70
-
71
-
72
-
73
-
74
-
75
-
76
-
77
-
78
-
79
-
80
-
81
-
82
-
83
-
84
-
85
-
86
-
87
-
88
-
89
-
90
-
91
-
92
-
93
-
94
-
95
-
96
-
97
-
98
-
99
-
100
-
101
-
102
-
103
-
104
-
105
-
106
-
107
-
108
-
109
 |
 |

Table of Contents
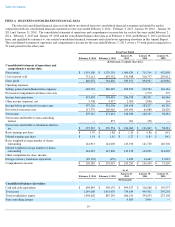
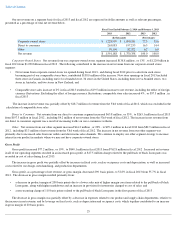
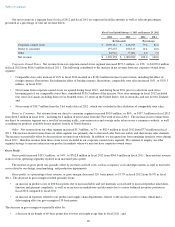
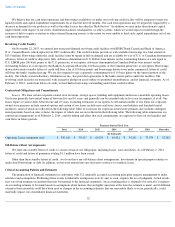
Our net revenue on a segment basis for fiscal 2013 and fiscal 2012 are expressed in dollar amounts as well as relevant percentages,
presented as a percentage of total net revenue below.
Corporate-Owned Stores. Net revenue from our corporate-owned stores segment increased $138.8 million , or 13% , to $1.229 billion in
fiscal 2013 from $1.090 billion in fiscal 2012 . The following contributed to the increase in net revenue from our corporate-owned stores
segment:
The increase in net revenue was partially offset by $18.7 million
of revenue from the 53rd week of fiscal 2012, which was excluded in the
calculation of comparable store sales.
Direct to Consumer. Net revenue from our direct to consumer segment increased $65.8 million , or 33% , to $263.1 million in fiscal 2013
from $197.3 million in fiscal 2012 , including $4.2 million of net revenue from the 53rd week of fiscal 2012. The increase in net revenue from
our direct to consumer segment was a result of increasing traffic on our e-commerce websites.
Other. Net revenue from our other segment increased $16.2 million , or 20% , to $99.1 million in fiscal 2013 from $82.9 million in fiscal
2012 , including $3.3 million of net revenue from the 53rd week of fiscal 2012. The increase in net revenue from our other segment was
primarily due to increased sales from our outlets and showrooms sales channels. We continue to employ our other segment strategy to increase
interest in our product in markets where we may not have corporate-owned stores.
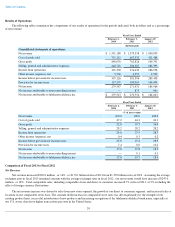
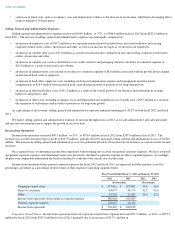
Gross Profit
Gross profit increased $77.2 million , or 10% , to $840.1 million in fiscal 2013 from $762.8 million in fiscal 2012 . Increased net revenue
in all of our operating segments resulted in an increased gross profit. A $17.5 million charge related to the pull-back of black Luon pants was
recorded in cost of sales during fiscal 2013.
The increase in gross profit was partially offset by increases in fixed costs, such as occupancy costs and depreciation, as well as increased
costs related to our design, merchandising, and production departments.
Gross profit, as a percentage of net revenue, or gross margin, decreased 290 basis points, to 52.8% in fiscal 2013 from 55.7% in fiscal
2012 . The decrease in gross margin resulted primarily from:
The decrease in gross margin was partially offset by a decrease in expenses related to our product and supply chain departments, relative to
the increase in net revenue, and by leverage on fixed costs, such as depreciation and occupancy costs, which together contributed to an increase
in gross margin of 20 basis points.
25
Fiscal Year Ended February 2, 2014 and February 3, 2013
2013
2012
2013
2012
(In thousands)
(Percentages)
Corporate-owned stores
$
1,228,999
$
1,090,181
77.3
79.6
Direct to consumer
263,083
197,255
16.5
14.4
Other
99,106
82,922
6.2
6.0
Net revenue
$
1,591,188
$
1,370,358
100.0
100.0
•
Net revenue from corporate
-owned stores we opened during fiscal 2013 , and during fiscal 2012 prior to sales from such stores
becoming part of our comparable stores base, contributed $138.0 million of the increase. New store openings in fiscal 2013 included
three stores in Canada, including one ivivva branded store, 36 stores in the United States, including three ivivva branded stores, two
stores in Australia, and two stores in New Zealand; and
• Comparable store sales increase of 2% in fiscal 2013 resulted in a $19.5 million increase to net revenue, including the effect of foreign
currency fluctuations. Excluding the effect of foreign currency fluctuations, comparable store sales increased 4% , or $37.3 million , in
fiscal 2013 .
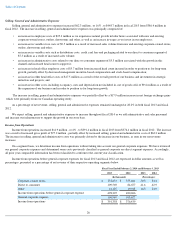
• a decrease in product margin of 200 basis points due to a lower sales mix of higher margin core items related to the pull-back of black
Luon pants, along with higher markdowns and an increase in provision for inventories charged to cost of sales; and
• a non-recurring charge of 110 basis points related to the pull-back of black Luon pants in the first quarter of fiscal 2013
.