Lululemon 2013 Annual Report Download - page 38
Download and view the complete annual report
Please find page 38 of the 2013 Lululemon annual report below. You can navigate through the pages in the report by either clicking on the pages listed below, or by using the keyword search tool below to find specific information within the annual report.-
 1
1 -
2
-
3
-
4
-
5
-
6
-
7
-
8
-
9
-
10
-
11
-
12
-
13
-
14
-
15
-
16
-
17
-
18
-
19
-
20
-
21
-
22
-
23
-
24
-
25
-
26
-
27
-
 28
28 -
 29
29 -
 30
30 -
 31
31 -
 32
32 -
 33
33 -
 34
34 -
 35
35 -
 36
36 -
 37
37 -
 38
38 -
 39
39 -
 40
40 -
 41
41 -
 42
42 -
 43
43 -
 44
44 -
 45
45 -
 46
46 -
 47
47 -
 48
48 -
49
-
50
-
51
-
52
-
53
-
54
-
55
-
56
-
57
-
58
-
59
-
60
-
61
-
62
-
63
-
64
-
65
-
66
-
67
-
68
-
69
-
70
-
71
-
72
-
73
-
74
-
75
-
76
-
77
-
78
-
79
-
80
-
81
-
82
-
83
-
84
-
85
-
86
-
87
-
88
-
89
-
90
-
91
-
92
-
93
-
94
-
95
-
96
-
97
-
98
-
99
-
100
-
101
-
102
-
103
-
104
-
105
-
106
-
107
-
108
-
109
 |
 |

Table of Contents
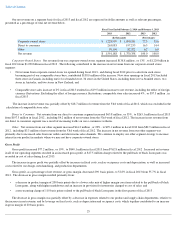
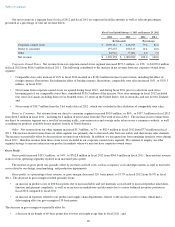
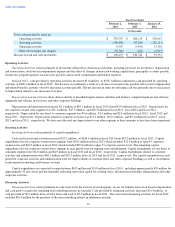
Operating Activities
Operating Activities consist primarily of net income adjusted for certain non-cash items, including provision for inventories, depreciation
and amortization, stock-based compensation expense and the effect of changes in non-cash working capital items, principally accounts payable,
inventories, prepaid expenses, income taxes payable, and accrued compensation and related expenses.
In fiscal 2013 , cash provided by operating activities decreased $1.8 million , to $278.3 million compared to cash provided by operating
activities of $280.1 million in fiscal 2012 . The decrease was primarily a result of a decrease in income taxes payable and accrued compensation
and related benefits, partially offset by increased accounts payable. The net increase in items not affecting cash was primarily due to an increase
in depreciation related to our increased store base.
Depreciation and amortization relate almost entirely to leasehold improvements, furniture and fixtures, computer hardware and software,
equipment and vehicles in our stores and other corporate buildings.
Depreciation and amortization increased $6.1 million to $49.1 million in fiscal 2013 from $43.0 million in fiscal 2012 . Depreciation for
our corporate-owned store segment was $31.3 million , $27.5 million , and $18.5 million in fiscal 2013 , fiscal 2012 and fiscal 2011 ,
respectively. Depreciation for our direct to consumer segment was $4.6 million , $3.4 million and $2.4 million in fiscal 2013 , fiscal 2012 and
fiscal 2011 , respectively. Depreciation related to corporate activities was $13.1 million , $12.1 million , and $9.4 million fiscal 2013 , fiscal
2012 and fiscal 2011 , respectively. We have not allocated any depreciation to our other segment as these amounts to date have been immaterial.
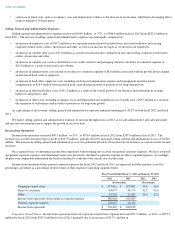
Investing Activities
Investing Activities relate primarily to capital expenditures.
Cash used in investing activities increased $13.2 million , to $106.4 million in fiscal 2013 from $93.2 million in fiscal 2012 . Capital
expenditures for our corporate-owned stores segment were $60.2 million in fiscal 2013 which included $31.3 million to open 45 corporate-
owned stores and $64.9 million in fiscal 2012 which included $29.8 million to open 37 corporate-owned stores. The remaining capital
expenditures for our corporate-owned stores segment in each period were for ongoing store refurbishment. Capital expenditures for our direct to
consumer segment were $6.0 million and $4.9 million in fiscal 2013 and fiscal 2012 , respectively. Capital expenditures related to corporate
activities and administration were $40.2 million and $23.5 million in fiscal 2013 and fiscal 2012 , respectively. The capital expenditures in each
period for corporate activities and administration were for improvements at our head office and other corporate buildings as well as investments
in information technology and business systems.
Capital expenditures are expected to range between $105 million and $110 million in fiscal 2014
, including approximately $35 million for
approximately 42 new stores and the remainder reflecting renovation capital for existing stores, information technology enhancements and other
corporate activities.
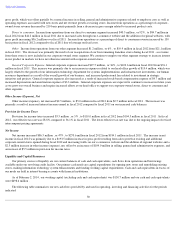
Financing Activities
Financing Activities consist primarily of cash received on the exercise of stock options, excess tax benefits from stock-
based compensation
and cash paid to acquire the remaining non-controlling interest in Australia. Cash provided by financing activities increased $14.4 million , to
cash provided of $8.9 million in fiscal 2013 from cash used of $5.5 million in fiscal 2012 . The cash used in financing activities for fiscal 2012
included $26.0 million for the purchase of the non-controlling interest in lululemon australia.
31
Fiscal Year Ended
February 2,
2014
February 3,
2013
January 29,
2012
(In thousands)
Total cash provided by (used in):
Operating activities
$
278,339
$
280,113
$
203,615
Investing activities
(106,408
)
(93,229
)
(122,311
)
Financing activities
8,907
(5,491
)
15,364
Effect of exchange rate changes
(72,368
)
(651
)
(3,517
)
Increase in cash and cash equivalents
$
108,470
$
180,742
$
93,151