Lululemon 2013 Annual Report Download - page 24
Download and view the complete annual report
Please find page 24 of the 2013 Lululemon annual report below. You can navigate through the pages in the report by either clicking on the pages listed below, or by using the keyword search tool below to find specific information within the annual report.-
 1
1 -
2
-
3
-
4
-
5
-
6
-
7
-
8
-
9
-
10
-
11
-
12
-
13
-
 14
14 -
 15
15 -
 16
16 -
 17
17 -
 18
18 -
 19
19 -
 20
20 -
 21
21 -
 22
22 -
 23
23 -
 24
24 -
 25
25 -
 26
26 -
 27
27 -
 28
28 -
 29
29 -
 30
30 -
 31
31 -
 32
32 -
 33
33 -
 34
34 -
35
-
36
-
37
-
38
-
39
-
40
-
41
-
42
-
43
-
44
-
45
-
46
-
47
-
48
-
49
-
50
-
51
-
52
-
53
-
54
-
55
-
56
-
57
-
58
-
59
-
60
-
61
-
62
-
63
-
64
-
65
-
66
-
67
-
68
-
69
-
70
-
71
-
72
-
73
-
74
-
75
-
76
-
77
-
78
-
79
-
80
-
81
-
82
-
83
-
84
-
85
-
86
-
87
-
88
-
89
-
90
-
91
-
92
-
93
-
94
-
95
-
96
-
97
-
98
-
99
-
100
-
101
-
102
-
103
-
104
-
105
-
106
-
107
-
108
-
109
 |
 |

Table of Contents
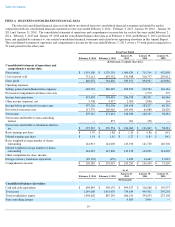
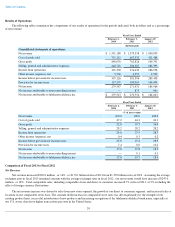
ITEM 6. SELECTED CONSOLIDATED FINANCIAL DATA
The selected consolidated financial data set forth below are derived from our consolidated financial statements and should be read in
conjunction with our consolidated financial statements for the years ended February 2, 2014 , February 3, 2013 , January 29, 2012 ,
January 30,
2011 and January 31, 2010 . The consolidated statement of operations and comprehensive income data for each of the years ended February 2,
2014 , February 3, 2013 and January 29, 2012 and the consolidated balance sheet data as of February 2, 2014 and February 3, 2013 are derived
from, and qualified by reference to, our audited consolidated financial statements and related notes appearing elsewhere in this Annual Report.
The consolidated statement of operations and comprehensive income for the year ended February 3, 2013 covers a 53 week period compared to a
52 week period for the other years.
19
Fiscal Year Ended
February 2, 2014
February 3, 2013
January 29,
2012
January 30,
2011
January 31,
2010
(In thousands, except per share data)
Consolidated statement of operations and
comprehensive income data:
Net revenue
$
1,591,188
$
1,370,358
1,000,839
$
711,704
$
452,898
Cost of goods sold
751,112
607,532
431,488
316,757
229,812
Gross profit
840,076
762,826
569,351
394,947
223,086
Operating expenses:
Selling, general and administrative expenses
448,718
386,387
282,393
212,784
136,161
Provision for impairment and lease exit costs
—
—
—
1,772
379
Income from operations
391,358
376,439
286,958
180,391
86,546
Other income (expense), net
5,768
4,957
2,500
2,886
164
Income before provision for income taxes
397,126
381,396
289,458
183,277
86,710
Provision for income taxes
117,579
109,965
104,494
61,080
28,429
Net income
279,547
271,431
184,964
122,197
58,281
Net income attributable to non-controlling
interest
—
875
901
350
—
Net income attributable to lululemon athletica
inc.
$
279,547
$
270,556
$
184,063
$
121,847
$
58,281
Basic earnings per share
$
1.93
$
1.88
$
1.29
$
0.86
$
0.41
Diluted earnings per share
$
1.91
$
1.85
$
1.27
$
0.85
$
0.41
Basic weighted-average number of shares
outstanding
144,913
144,000
143,196
141,720
140,502
Diluted weighted-average number of shares
outstanding
146,043
145,806
145,278
143,858
141,898
Other comprehensive (loss) income:
Foreign currency translation adjustment
(89,158
)
(459
)
1,220
14,462
17,018
Comprehensive income
$
190,389
$
270,097
$
185,283
$
136,309
$
75,299
As of
February 2, 2014
February 3, 2013
January 29,
2012
January 30,
2011
January 31,
2010
(In thousands)
Consolidated balance sheet data:
Cash and cash equivalents
$
698,649
$
590,179
$
409,437
$
316,286
$
159,573
Total assets
1,249,688
1,051,078
734,634
499,302
307,258
Total stockholders' equity
1,096,682
887,299
606,181
394,293
233,108
Non-controlling interest
—
—
4,805
3,904
—