Lululemon 2013 Annual Report Download - page 22
Download and view the complete annual report
Please find page 22 of the 2013 Lululemon annual report below. You can navigate through the pages in the report by either clicking on the pages listed below, or by using the keyword search tool below to find specific information within the annual report.-
 1
1 -
2
-
3
-
4
-
5
-
6
-
7
-
8
-
9
-
10
-
11
-
 12
12 -
 13
13 -
 14
14 -
 15
15 -
 16
16 -
 17
17 -
 18
18 -
 19
19 -
 20
20 -
 21
21 -
 22
22 -
 23
23 -
 24
24 -
 25
25 -
 26
26 -
 27
27 -
 28
28 -
 29
29 -
 30
30 -
 31
31 -
 32
32 -
33
-
34
-
35
-
36
-
37
-
38
-
39
-
40
-
41
-
42
-
43
-
44
-
45
-
46
-
47
-
48
-
49
-
50
-
51
-
52
-
53
-
54
-
55
-
56
-
57
-
58
-
59
-
60
-
61
-
62
-
63
-
64
-
65
-
66
-
67
-
68
-
69
-
70
-
71
-
72
-
73
-
74
-
75
-
76
-
77
-
78
-
79
-
80
-
81
-
82
-
83
-
84
-
85
-
86
-
87
-
88
-
89
-
90
-
91
-
92
-
93
-
94
-
95
-
96
-
97
-
98
-
99
-
100
-
101
-
102
-
103
-
104
-
105
-
106
-
107
-
108
-
109
 |
 |

Table of Contents
PART II
ITEM 5. MARKET FOR REGISTRANT'S COMMON EQUITY, RELATED STOCKHOLDER MATTERS AND ISSUER PURCHASES
OF EQUITY SECURITIES
Market Information and Dividends
Our common stock is quoted on the Nasdaq Global Select Market under the symbol "LULU." Our common stock was also previously
listed on the Toronto Stock Exchange ("TSX") under the symbol "LLL." During fiscal 2013 we voluntarily delisted from the TSX because we
believe the minimal trading volume of our shares on the TSX no longer justified the expense and administrative efforts associated with
maintaining a dual listing.
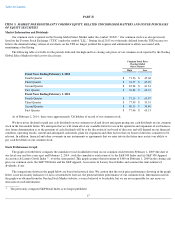
The following table sets forth, for the periods indicated, the high and low closing sale prices of our common stock reported by the Nasdaq
Global Select Market for the last two fiscal years:
As of February 2, 2014 , there were approximately 526 holders of record of our common stock.
We have never declared or paid any cash dividends on our common stock and do not anticipate paying any cash dividends on our common
stock in the foreseeable future. We anticipate that we will retain all of our available funds for use in the operation and expansion of our business.
Any future determination as to the payment of cash dividends will be at the discretion of our board of directors and will depend on our financial
condition, operating results, current and anticipated cash needs, plans for expansion and other factors that our board of directors considers to be
relevant. In addition, financial and other covenants in any instruments or agreements that we enter into in the future may restrict our ability to
pay cash dividends on our common stock.
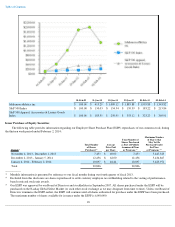
Stock Performance Graph
The graph set forth below compares the cumulative total stockholder return on our common stock between February 1, 2009 (the date of
our fiscal year end five years ago) and February 2, 2014 , with the cumulative total return of (i) the S&P 500 Index and (ii) S&P 500 Apparel,
Accessories & Luxury Goods Index
(1)
, over the same period. This graph assumes the investment of $100 on February 1, 2009 in the closing sale
price our common stock, the S&P 500 Index and the S&P Apparel, Accessories & Luxury Goods Index and assumes the reinvestment of
dividends, if any.
The comparisons shown in the graph below are based on historical data. We caution that the stock price performance showing in the graph
below is not necessarily indicative of, nor is it intended to forecast, the potential future performance of our common stock. Information used in
the graph was obtained from the Nasdaq Stock Market website, a source believed to be reliable, but we are not responsible for any errors or
omissions in such information.
__________
17
Common Stock Price
(Nasdaq Global
Select Market)
High
Low
Fiscal Year Ending February 2, 2014
Fourth Quarter
$
71.56
$
45.68
Third Quarter
$
76.57
$
65.29
Second Quarter
$
82.28
$
61.33
First Quarter
$
76.88
$
62.32
Fiscal Year Ending February 3, 2013
Fourth Quarter
$
77.19
$
65.87
Third Quarter
$
77.99
$
53.35
Second Quarter
$
80.30
$
54.40
First Quarter
$
77.06
$
63.13
(1)
The previously compared S&P Retail Index is no longer published.