JVC 2000 Annual Report Download - page 35
Download and view the complete annual report
Please find page 35 of the 2000 JVC annual report below. You can navigate through the pages in the report by either clicking on the pages listed below, or by using the keyword search tool below to find specific information within the annual report.-
 1
1 -
2
-
3
-
4
-
5
-
6
-
7
-
8
-
9
-
10
-
11
-
12
-
13
-
14
-
15
-
16
-
17
-
18
-
19
-
20
-
21
-
22
-
23
-
24
-
 25
25 -
 26
26 -
 27
27 -
 28
28 -
 29
29 -
 30
30 -
 31
31 -
 32
32 -
 33
33 -
 34
34 -
 35
35 -
 36
36 -
 37
37 -
 38
38 -
 39
39 -
 40
40 -
 41
41 -
 42
42
 |
 |

JVC 2000 33
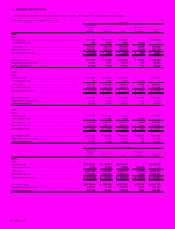
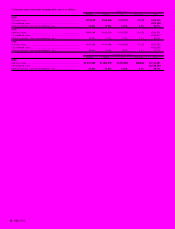
2) Geographical segment information is as follows: Millions of yen
Elimination and Consolidated
Japan Americas Europe Asia Total unallocation total
2000:
Sales
External sales ................................ ¥416,271 ¥249,451 ¥145,709 ¥ 58,804 ¥ 870,235 ¥ —¥ 870,235
Intersegment sales ........................ 238,687 431 183 141,377 380,678 (380,678) —
Total sales...................................... 654,958 249,882 145,892 200,181 1,250,913 (380,678) 870,235
Operating expenses......................... 671,232 247,581 144,276 198,170 1,261,259 (383,005) 878,254
Operating income (loss)................... ¥ (16,274) ¥ 2,301 ¥ 1,616 ¥ 2,011 ¥ (10,346) ¥ 2,327 ¥ (8,019)
Identifiable assets ............................ ¥359,991 ¥110,231 ¥ 52,158 ¥ 57,298 ¥ 579,678 ¥ (39,319) ¥ 540,359
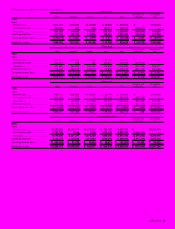
Millions of yen
Elimination and Consolidated
Japan Americas Europe Asia Total unallocation total
1999:
Sales
External sales ................................ ¥474,911 ¥263,530 ¥156,044 ¥52,132 ¥ 946,617 ¥—¥946,617
Intersegment sales ........................ 246,614 798 146 122,817 370,375 (370,375) —
Total sales...................................... 721,525 264,328 156,190 174,949 1,316,992 (370,375) 946,617
Operating expenses......................... 718,296 265,448 155,913 175,655 1,315,312 (367,474) 947,838
Operating income (loss)................... ¥3,229 ¥ (1,120) ¥ 277 ¥ (706) ¥ 1,680 ¥ (2,901) ¥ (1,221)
Identifiable assets ............................ ¥378,124 ¥93,712 ¥64,676 ¥59,943 ¥ 596,455 ¥ (8,454) ¥588,001
Millions of yen
Elimination and Consolidated
Japan Americas Europe Asia Total unallocation total
1998:
Sales
External sales ................................ ¥496,970 ¥228,932 ¥137,625 ¥52,779 ¥ 916,306 ¥—¥916,306
Intersegment sales ........................ 217,691 1,572 73 103,222 322,558 (322,558) —
Total sales...................................... 714,661 230,504 137,698 156,001 1,238,864 (322,558) 916,306
Operating expenses......................... 705,765 231,694 135,660 154,860 1,227,979 (321,689) 906,290
Operating income (loss)................... ¥8,896 ¥ (1,190) ¥ 2,038 ¥1,141 ¥10,885 ¥ (869) ¥ 10,016
Identifiable assets ............................ ¥394,610 ¥100,468 ¥69,601 ¥59,033 ¥ 623,712 ¥ 338 ¥624,050
Thousands of U.S. dollars
Elimination and Consolidated
Japan Americas Europe Asia Total unallocation total
2000:
Sales
External sales.............................. $3,927,085 $2,353,311 $1,374,613 $ 554,755 $ 8,209,764 $ —$8,209,764
Intersegment sales...................... 2,251,765 4,066 1,726 1,333,745 3,591,302 (3,591,302) —
Total sales................................... 6,178,850 2,357,377 1,376,339 1,888,500 11,801,066 (3,591,302) 8,209,764
Operating expenses...................... 6,332,378 2,335,669 1,361,094 1,869,528 11,898,669 (3,613,254) 8,285,415
Operating income (loss)................. $ (153,528) $ 21,708 $ 15,245 $ 18,972 $ (97,603) $ 21,952 $ (75,651)
Identifiable assets.......................... $3,396,141 $1,039,915 $ 492,057 $ 540,547 $ 5,468,660 $ (370,934) $5,097,726