JVC 2000 Annual Report Download - page 23
Download and view the complete annual report
Please find page 23 of the 2000 JVC annual report below. You can navigate through the pages in the report by either clicking on the pages listed below, or by using the keyword search tool below to find specific information within the annual report.-
 1
1 -
2
-
3
-
4
-
5
-
6
-
7
-
8
-
9
-
10
-
11
-
12
-
 13
13 -
 14
14 -
 15
15 -
 16
16 -
 17
17 -
 18
18 -
 19
19 -
 20
20 -
 21
21 -
 22
22 -
 23
23 -
 24
24 -
 25
25 -
 26
26 -
 27
27 -
 28
28 -
 29
29 -
 30
30 -
 31
31 -
 32
32 -
 33
33 -
34
-
35
-
36
-
37
-
38
-
39
-
40
-
41
-
42
 |
 |

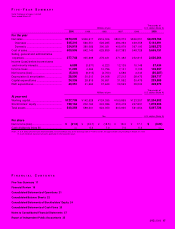
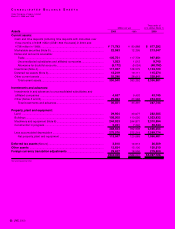
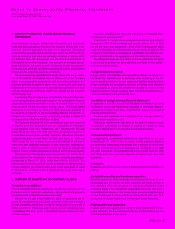
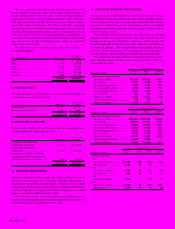
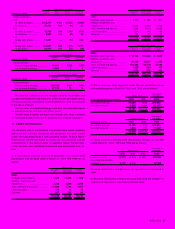
JVC 2000 21
Thousands of
Millions of yen U.S. dollars (Note 1)
2000 1999 1998 2000
Net sales ...................................................................................... ¥870,235 ¥946,617 ¥916,306 $8,209,764
Costs and expenses:
Cost of sales............................................................................... 600,506 642,140 629,859 5,665,151
Selling, general and administrative expenses.............................. 277,748 305,698 276,431 2,620,264
............................................................................................... 878,254 947,838 906,290 8,285,415
Operating income (loss).............................................................. (8,019) (1,221) 10,016 (75,651)
Other income (expenses):
Interest and dividend income ...................................................... 2,408 2,407 1,937 22,717
Unrealized gain from appreciation of trading securities ............... 16,386 2,325 —154,585
Equity in income of affiliated companies...................................... 36 453 295 340
Interest expense.......................................................................... (6,178) (8,692) (5,671) (58,283)
Gain on sales of investment securities ........................................ 6,330 530 893 59,717
Loss on liquidation of subsidiaries............................................... (451) (2,293) —(4,255)
Loss from financial support of affiliated companies ..................... —(1,122) (1,356) —
Restructuring charges................................................................. (2,662) (537) (2,063) (25,113)
Other, net.................................................................................... (1,762) 4,479 2,172 (16,623)
............................................................................................... 14,107 (2,450) (3,793) 133,085
Income (Loss) before income taxes
and minority interests................................................................. 6,088 (3,671) 6,223 57,434
Income taxes (Note 6):
Current........................................................................................ 8,622 6,443 7,488 81,340
Deferred...................................................................................... 2,673 (1,977) 3,308 25,217
............................................................................................... 11,295 4,466 10,796 106,557
Loss before minority interests ................................................... (5,207) (8,137) (4,573) (49,123)
Minority interests ........................................................................ (134) (178) (130) (1,264)
Net loss ......................................................................................... ¥ (5,341) ¥(8,315) ¥(4,703) $ (50,387)
Yen U.S. dollars (Note 2)
Amounts per share of common stock:
Net loss....................................................................................... ¥ (21.0) ¥ (32.7) ¥ (18.5) $ (0.20)
Cash dividends applicable to the year ........................................ —5.0 7.0 —
See accompanying notes.
CONSOLIDATED STATEMENTS OF OPERATIONS
Victor Company of Japan, Limited
Years ended March 31, 2000, 1999 and 1998