JVC 2000 Annual Report Download - page 27
Download and view the complete annual report
Please find page 27 of the 2000 JVC annual report below. You can navigate through the pages in the report by either clicking on the pages listed below, or by using the keyword search tool below to find specific information within the annual report.-
 1
1 -
2
-
3
-
4
-
5
-
6
-
7
-
8
-
9
-
10
-
11
-
12
-
13
-
14
-
15
-
16
-
 17
17 -
 18
18 -
 19
19 -
 20
20 -
 21
21 -
 22
22 -
 23
23 -
 24
24 -
 25
25 -
 26
26 -
 27
27 -
 28
28 -
 29
29 -
 30
30 -
 31
31 -
 32
32 -
 33
33 -
 34
34 -
 35
35 -
 36
36 -
 37
37 -
38
-
39
-
40
-
41
-
42
 |
 |

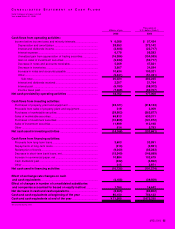
JVC 2000 25
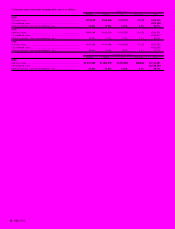
Thousands of
Millions of yen U.S. dollars (Note 1)
2000 2000
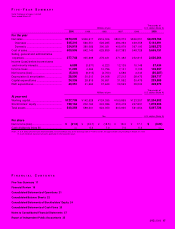
Cash flows from operating activities:
Income before income taxes and minority interests............................. ¥6,088 $ 57,434)
Depreciation and amortization......................................................... 28,953 273,142
Interest and dividends income......................................................... (2,408) (22,717)
Interest expense.............................................................................. 6,178 58,283
Unrealized gain from appreciation of trading securities.................... (16,386) (154,585)
Gain on sales of investment securities............................................. (6,330) (59,717)
Decrease in notes and accounts receivable.................................... 5,069 47,821
Decrease in inventories ................................................................... 3,667 34,594
Increase in notes and accounts payable ......................................... 10,634 100,321
Other............................................................................................... (5,441) (51,331)
Sub-total..................................................................................... 30,024 283,245
Interest and dividends received ....................................................... 2,307 21,764
Interest paid .................................................................................... (6,180) (58,302)
Income taxes paid........................................................................... (7,389) (69,707)
Net cash provided by operating activities ........................................ 18,762 177,000
Cash flows from investing activities:
Purchases of property, plant and equipment ....................................... (23,121) (218,123)
Proceeds from sales of property, plant and equipment........................ 319 3,009
Purchases of marketable securities ..................................................... (59,983) (565,877)
Sales of marketable securities ............................................................. 66,813 630,311
Purchases of investment securities...................................................... (10,809) (101,972)
Sales of investment securities.............................................................. 11,999 113,198
Other................................................................................................... 614 5,793
Net cash used in investing activities ................................................. (14,168) (133,661)
Cash flows from financing activities:
Proceeds from long-term loans ........................................................... 3,603 33,991
Repayments of long-term loans........................................................... (316) (2,981)
Redemption of bonds.......................................................................... (9,040) (85,283)
Decrease in short-term bank loans, net............................................... (15,549) (146,689)
Increase in commercial paper, net ....................................................... 10,884 102,679
Cash dividends paid ............................................................................ (632) (5,962)
Other................................................................................................... 315 2,971
Net cash used in financing activities ................................................ (10,735) (101,274)
Effect of exchange rate changes on cash
and cash equivalents .......................................................................... (4,188) (39,509)
Effect of changes in number of consolidated subsidiaries
and companies accounted for based on equity method................ 1,764 16,642
Net decrease in cash and cash equivalents...................................... (8,565) (80,802)
Cash and cash equivalents at beginning of the year ...................... 80,150 756,132
Cash and cash equivalents at end of the year ................................. ¥71,585 $ 675,330
See accompanying notes.
CONSOLIDATED STATEMENT OF CASH FLOWS
Victor Company of Japan, Limited
Year ended March 31, 2000