JVC 2000 Annual Report Download - page 19
Download and view the complete annual report
Please find page 19 of the 2000 JVC annual report below. You can navigate through the pages in the report by either clicking on the pages listed below, or by using the keyword search tool below to find specific information within the annual report.-
 1
1 -
2
-
3
-
4
-
5
-
6
-
7
-
8
-
 9
9 -
 10
10 -
 11
11 -
 12
12 -
 13
13 -
 14
14 -
 15
15 -
 16
16 -
 17
17 -
 18
18 -
 19
19 -
 20
20 -
 21
21 -
 22
22 -
 23
23 -
 24
24 -
 25
25 -
 26
26 -
 27
27 -
 28
28 -
 29
29 -
30
-
31
-
32
-
33
-
34
-
35
-
36
-
37
-
38
-
39
-
40
-
41
-
42
 |
 |

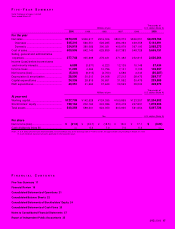
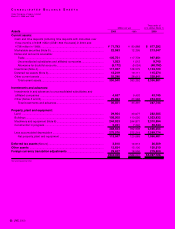
JVC 2000 17
Thousands of
Millions of yen U.S. dollars (Note A)
2000 1999 1998 1997 1996 2000
For the year
Net sales................................................... ¥870,235 ¥946,617 ¥916,306 ¥890,373 ¥806,551 $8,209,764
Overseas .............................................. 545,316 566,551 526,285 484,394 409,358 5,144,491
Domestic .............................................. 324,919 380,066 390,021 405,979 397,193 3,065,273
Cost of sales............................................. 600,506 642,140 629,859 607,383 548,728 5,665,151
Selling, general and administrative
expenses ................................................. 277,748 305,698 276,431 271,482 252,815 2,620,264
Income (Loss) before income taxes
and minority interests ............................... 6,088 (3,671) 6,223 12,139 10,148 57,434
Income taxes ............................................ 11,295 4,466 10,796 7,141 3,135 106,557
Net income (loss)...................................... (5,341) (8,315) (4,703) 4,586 4,343 (50,387)
Depreciation & amortization ...................... 28,590 30,513 24,008 27,212 28,475 269,717
Capital expenditures ................................. 24,336 28,815 36,651 31,552 30,479 229,585
R&D expenditures..................................... 43,351 41,660 37,649 39,563 38,500 408,972
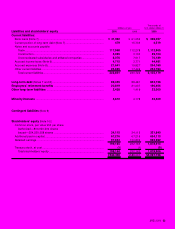
Thousands of
Millions of yen U.S. dollars (Note A)
At year-end
Working capital ......................................... ¥127,709 ¥142,628 ¥124,395 ¥160,869 ¥123,357 $1,204,802
Stockholders’ equity ................................. 199,164 232,162 243,086 250,418 247,891 1,878,906
Total assets............................................... 540,359 588,001 624,050 603,920 561,654 5,097,726
Yen U.S. dollars (Note A)
Per share
Net income (loss)...................................... ¥ (21.0) ¥ (32.7) ¥ (18.5) ¥ 18.0 ¥ 17.1 $ (0.20)
Cash dividends (Note B) ........................... —5.0 7.0 7.0 5.0 —
Notes: A. U.S. dollar amounts have been translated, for convenience only, at the exchange rate of ¥106 to U.S.$1, the approximate rate prevailing on March 31, 2000.
B. Cash dividends represent amounts applicable to the respective years.
FIVE-YEAR SUMMARY
Victor Company of Japan, Limited
Years ended March 31
FINANCIAL CONTENTS
Five-Year Summary 17
Financial Review 18
Consolidated Statements of Operations 21
Consolidated Balance Sheets 22
Consolidated Statements of Stockholders’ Equity 24
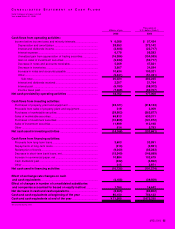
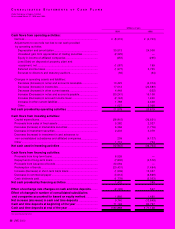
Consolidated Statements of Cash Flows 25
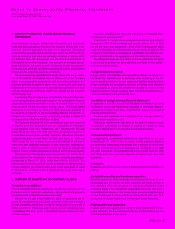
Notes to Consolidated Financial Statements 27
Report of Independent Public Accountants 35