JVC 2000 Annual Report Download - page 28
Download and view the complete annual report
Please find page 28 of the 2000 JVC annual report below. You can navigate through the pages in the report by either clicking on the pages listed below, or by using the keyword search tool below to find specific information within the annual report.-
 1
1 -
2
-
3
-
4
-
5
-
6
-
7
-
8
-
9
-
10
-
11
-
12
-
13
-
14
-
15
-
16
-
17
-
 18
18 -
 19
19 -
 20
20 -
 21
21 -
 22
22 -
 23
23 -
 24
24 -
 25
25 -
 26
26 -
 27
27 -
 28
28 -
 29
29 -
 30
30 -
 31
31 -
 32
32 -
 33
33 -
 34
34 -
 35
35 -
 36
36 -
 37
37 -
 38
38 -
39
-
40
-
41
-
42
 |
 |

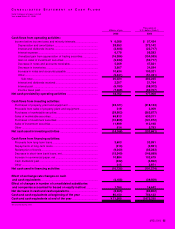
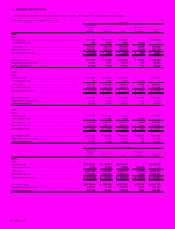
26 JVC 2000
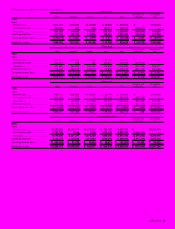
Millions of yen
1999 1998
Cash flows from operating activities:
Net loss ............................................................................................... ¥(8,315) ¥(4,703)19)
Adjustments to reconcile net loss to net cash provided
by operating activities:
Depreciation and amortization......................................................... 30,513 24,008
Unrealized gain from appreciation of trading securities.................... (2,325) —
Equity in income of affiliated companies.......................................... (453) (295)
Loss (Gain) on disposal of property, plant and
equipment, net............................................................................... (1,087) 199
Deferred income taxes .................................................................... (1,977) 3,755
Bonuses to directors and statutory auditors.................................... (92) (94)
Changes in operating assets and liabilities:
Decrease (Increase) in notes and accounts receivable .................... 13,423 (2,074)
Decrease (Increase) in inventories ................................................... 17,012 (20,689)
Decrease (Increase) in other current assets..................................... 4,449 (532)
Increase (Decrease) in notes and accounts payable........................ (30,241) 15,108
Increase (Decrease) in accrued income taxes ................................. (2,144) 1,420
Increase in other current liabilities.................................................... 1,788 2,448
Other............................................................................................... 1,027 2,068
Net cash provided by operating activities ........................................ 21,578 20,619
Cash flows from investing activities:
Capital expenditures............................................................................ (28,815) (36,651)
Proceeds from sales of fixed assets .................................................... 5,382 2,027
Decrease (Increase) in marketable securities ....................................... 6,366 (1,776)
Decrease in investment securities........................................................ 2,203 3,079
Decrease (Increase) in investment in and advances to
non-consolidated subsidiaries and affiliated companies ..................... 209 (4,137)
Other................................................................................................... 1,712 754
Net cash used in investing activities ................................................. (12,943) (36,704)
Cash flows from financing activities:
Proceeds from long-term loans ........................................................... 6,526 —
Repayments of long-term loans........................................................... (7,830) (2,572)
Proceeds from issuance of bonds....................................................... 30,094 —
Redemption of bonds.......................................................................... (20,431) (1,494)
Increase (Decrease) in short-term bank loans...................................... (1,536) 13,357
Decrease in commercial paper............................................................ (3,612) (6,869)
Cash dividends paid............................................................................ (1,779) (2,033)
Net cash provided by financing activities ......................................... 1,432 389
Effect of exchange rate changes on cash and time deposits......... (2,193) 567
Effect of changes in number of consolidated subsidiaries
and companies accounted for based on equity method................ 1,866 1,480
Net increase (decrease) in cash and time deposits ........................ 9,740 (13,649)
Cash and time deposits at beginning of the year ............................ 71,148 84,797
Cash and time deposits at end of the year ...................................... ¥80,888 ¥71,148
See accompanying notes.
CONSOLIDATED STATEMENTS OF CASH FLOWS
Victor Company of Japan, Limited
Years ended March 31, 1999 and 1998