JVC 2000 Annual Report Download - page 34
Download and view the complete annual report
Please find page 34 of the 2000 JVC annual report below. You can navigate through the pages in the report by either clicking on the pages listed below, or by using the keyword search tool below to find specific information within the annual report.-
 1
1 -
2
-
3
-
4
-
5
-
6
-
7
-
8
-
9
-
10
-
11
-
12
-
13
-
14
-
15
-
16
-
17
-
18
-
19
-
20
-
21
-
22
-
23
-
 24
24 -
 25
25 -
 26
26 -
 27
27 -
 28
28 -
 29
29 -
 30
30 -
 31
31 -
 32
32 -
 33
33 -
 34
34 -
 35
35 -
 36
36 -
 37
37 -
 38
38 -
 39
39 -
 40
40 -
 41
41 -
 42
42
 |
 |

32 JVC 2000
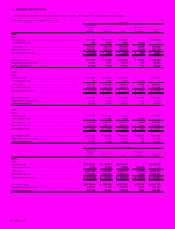
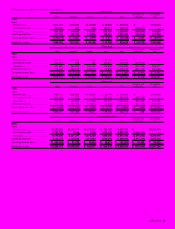
13. SEGMENT INFORMATION
Information by segment for the years ended March 31, 2000, 1999 and 1998 is shown in the tables below.
1) Business segment information is as follows: Millions of yen
Audiovisual and
information- Eliminations
related Entertainment and Consolidated
business business Total unallocation total
2000:
Sales
External sales.................................................................................. ¥745,062 ¥125,173 ¥870,235 ¥ —¥ 870,235
Intersegment sales .......................................................................... 355 1,601 1,956 (1,956) —
Total sales ....................................................................................... 745,417 126,774 872,191 (1,956) 870,235
Operating expenses .......................................................................... 756,041 123,219 879,260 (1,006) 878,254
Operating income (loss)..................................................................... ¥ (10,624) ¥ 3,555 ¥ (7,069) ¥ (950) ¥ (8,019)
Identifiable assets.............................................................................. ¥378,737 ¥ 84,693 ¥463,430 ¥ 76,929 ¥ 540,359
Depreciation & amortization............................................................... 24,544 3,671 28,215 375 28,590
Capital expenditures.......................................................................... 21,529 2,655 24,184 152 24,336
1999:
Sales
External sales.................................................................................. ¥797,682 ¥148,935 ¥946,617 ¥— ¥946,617
Intersegment sales .......................................................................... 55 1,330 1,385 (1,385) —
Total sales ....................................................................................... 797,737 150,265 948,002 (1,385) 946,617
Operating expenses .......................................................................... 802,298 145,715 948,013 (175) 947,838
Operating income (loss)..................................................................... ¥(4,561) ¥4,550 ¥(11) ¥(1,210) ¥(1,221)
Identifiable assets.............................................................................. ¥407,814 ¥76,738 ¥484,552 ¥103,449 ¥588,001
Depreciation & amortization............................................................... 26,542 3,622 30,164 349 30,513
Capital expenditures.......................................................................... 25,093 3,444 28,537 278 28,815
1998:
Sales
External sales.................................................................................. ¥779,603 ¥136,703 ¥916,306 ¥— ¥916,306
Intersegment sales .......................................................................... —1,968 1,968 (1,968) —
Total sales ....................................................................................... 779,603 138,671 918,274 (1,968) 916,306
Operating expenses .......................................................................... 774,720 133,111 907,831 (1,541) 906,290
Operating income ............................................................................. ¥4,883 ¥5,560 ¥10,443 ¥(427) ¥10,016
Identifiable assets.............................................................................. ¥431,647 ¥84,056 ¥515,703 ¥108,347 ¥624,050
Depreciation & amortization............................................................... 19,733 3,695 23,428 580 24,008
Capital expenditures.......................................................................... 33,637 2,829 36,466 185 36,651
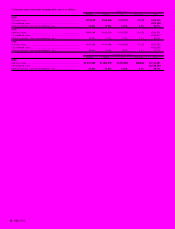
Thousands of U.S. dollars
Audiovisual and
information- Eliminations
related Entertainment and Consolidated
business business Total unallocation total
2000:
Sales
External sales.................................................................................. $7,028,887 $1,180,877 $8,209,764 $ —$8,209,764
Intersegment sales .......................................................................... 3,349 15,104 18,453 (18,453) —
Total sales ....................................................................................... 7,032,236 1,195,981 8,228,217 (18,453) 8,209,764
Operating expenses .......................................................................... 7,132,462 1,162,443 8,294,905 (9,490) 8,285,415
Operating income (loss)..................................................................... $ (100,226) $ 33,538 $ (66,688) $ (8,963) $ (75,651)
Identifiable assets.............................................................................. $3,572,990 $ 798,991 $4,371,981 $725,745 $5,097,726
Depreciation & amortization............................................................... 231,547 34,632 266,179 3,538 269,717
Capital expenditures.......................................................................... 203,104 25,047 228,151 1,434 229,585