JVC 2000 Annual Report Download - page 31
Download and view the complete annual report
Please find page 31 of the 2000 JVC annual report below. You can navigate through the pages in the report by either clicking on the pages listed below, or by using the keyword search tool below to find specific information within the annual report.-
 1
1 -
2
-
3
-
4
-
5
-
6
-
7
-
8
-
9
-
10
-
11
-
12
-
13
-
14
-
15
-
16
-
17
-
18
-
19
-
20
-
 21
21 -
 22
22 -
 23
23 -
 24
24 -
 25
25 -
 26
26 -
 27
27 -
 28
28 -
 29
29 -
 30
30 -
 31
31 -
 32
32 -
 33
33 -
 34
34 -
 35
35 -
 36
36 -
 37
37 -
 38
38 -
 39
39 -
 40
40 -
 41
41 -
42
 |
 |

JVC 2000 29
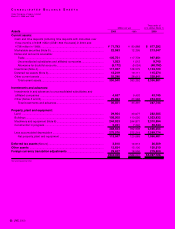
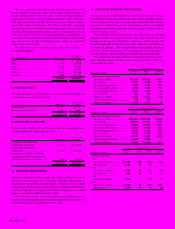
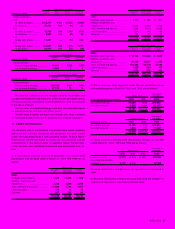
4. INVENTORIES
Inventories at March 31, 2000 and 1999 were as follows:
Thousands of
Millions of yen U.S.dollars
2000 1999 2000
Finished goods........................... ¥ 74,953 ¥87,851 $ 707,104
Work in process ......................... 17,143 17,834 161,727
Raw materials and supplies........ 24,941 22,894 235,292
.................................................. ¥117,037 ¥128,579 $1,104,123
5. MARKETABLE EQUITY SECURITIES
The aggregate book value, market value and unrealized gains pertain-
ing to marketable equity securities included in “marketable securities”
and “investments and advances — other” in the accompanying consol-
idated balance sheets at March 31, 2000 and 1999 were as follows:
Thousands of
Millions of yen U.S.dollars
2000 1999 2000
Marketable securities:
Book value................................. ¥15,295 ¥2,689 $144,292
Market value .............................. 16,029 2,898 151,217
Unrealized gains......................... ¥ 734 ¥209 $ 6,925
Investments and
advances—other:
Book value................................. ¥15,120 ¥10,137 $142,642
Market value .............................. 22,864 21,112 215,699
Unrealized gains......................... ¥ 7,744 ¥10,975 $ 73,057
6. INCOME TAXES
Income taxes in Japan consist of corporation, enterprise and inhabi-
tants taxes. The Company and its domestic consolidated subsidiaries
are subject to the income taxes referred to above which, in the aggre-
gate, resulted in statutory tax rates of approximately 42% for the year
ended March 31, 2000, 48% for the year ended March 31, 1999 and
51% for the year ended March 31, 1998. Foreign subsidiaries are sub-
ject to income taxes of the countries in which they domicile.
The following table summarizes the significant differences between
the statutory tax rate and the Company’s effective tax for financial state-
ment purposes for the year ended March 31, 2000:
Statutory tax rate ............................................................. 42.0%
Lower tax rates of overseas subsidiaries..................... (11.3)%
Expenses not deductible for tax purposes.................. 53.0%
Effect of changes in valuation allowance
for deferred tax assets ............................................... 93.6%
Other .......................................................................... 8.2%
Effective tax rate .............................................................. 185.5%
Significant components of the Company’s deferred tax assets and
liabilities at March 31, 2000 are as follows:
Thousands of
Millions of yen U.S. dollars
2000 2000
Deferred tax assets:
Loss on devaluation of inventory...... ¥ 5,464 $ 51,547
Accrued expenses not deductible
for tax purposes ............................. 4,264 40,227
Depreciation .................................... 8,372 78,981
Retirement and severance benefits.. 2,811 26,519
Tax loss carryforwards ..................... 12,591 118,783
Other............................................... 8,121 76,613
Total gross deferred tax assets...... 41,623 392,670
Less valuation allowance............... 26,206 247,226
Net deferred tax assets ................. ¥15,417 $145,444
Deferred tax liabilities:
Unrealized gain from appreciation
of trading securities ........................ ¥(4,223) $(39,840)
Other............................................... (897) (8,462)
Total gross deferred tax assets...... ¥(5,120) $(48,302)
Net deferred tax assets ................. ¥10,297 $ 97,142
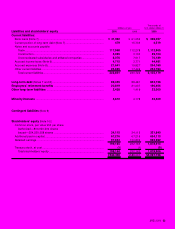
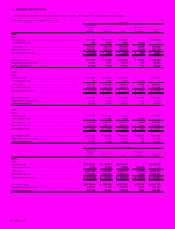
7. SHORT-TERM BANK LOANS AND LONG-TERM DEBT
Short-term bank loans of certain of the Company’s consolidated sub-
sidiaries consist of notes maturing generally in three months. The ap-
plicable annual interest rates on short-term bank loans outstanding at
March 31, 2000 and 1999 ranged from 0.73% to 23.64% and from
0.575% to 19.0%, respectively.
Long-term debt at March 31, 2000 and 1999 was as follows:
Thousands of
Millions of yen U.S. dollars
2000 1999 2000
1.5% unsecured convertible
bonds due 2005 ........................ ¥11,483 ¥ 11,483 $108,330
0.35% unsecured convertible
bonds due 2002 ........................ 19,999 19,999 188,670
0.55% unsecured convertible
bonds due 2005 ........................ 20,000 20,000 188,679
4.3% Eurobonds due 2000.......... —9,765 —
1.375% unsecured
bonds due 2001....................... 5,000 5,000 47,170
1.75% unsecured
bonds due 2003....................... 5,000 5,000 47,170
2.15% unsecured
bonds due 2005....................... 10,000 10,000 94,339
1.30% guaranteed
notes due 2001 ........................ 4,561 5,180 43,028
1.61% guaranteed
notes due 2002 ........................ 4,327 4,914 40,821
Loans, primarily from banks
with
interest principally at 0.79%
to 9.20%
Secured .................................. 221 379 2,085
Unsecured .............................. 9,323 12,494 87,953
.................................................... 89,914 104,214 848,245
Less current portion..................... 479 15,733 4,519
.................................................... ¥89,435 ¥ 88,481 $843,726