JVC 2000 Annual Report Download - page 22
Download and view the complete annual report
Please find page 22 of the 2000 JVC annual report below. You can navigate through the pages in the report by either clicking on the pages listed below, or by using the keyword search tool below to find specific information within the annual report.-
 1
1 -
2
-
3
-
4
-
5
-
6
-
7
-
8
-
9
-
10
-
11
-
 12
12 -
 13
13 -
 14
14 -
 15
15 -
 16
16 -
 17
17 -
 18
18 -
 19
19 -
 20
20 -
 21
21 -
 22
22 -
 23
23 -
 24
24 -
 25
25 -
 26
26 -
 27
27 -
 28
28 -
 29
29 -
 30
30 -
 31
31 -
 32
32 -
33
-
34
-
35
-
36
-
37
-
38
-
39
-
40
-
41
-
42
 |
 |

20 JVC 2000
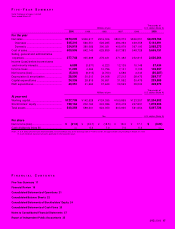
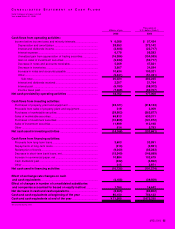
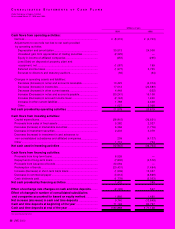
As a result, free cash flows totaled ¥4,594 million (US$43.3
million). Cash and cash equivalents at end of the year de-
creased 10.7% to ¥71,585 million (US$675.3 million) com-
pared with cash and cash equivalents at beginning of the year.
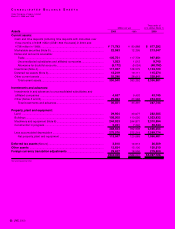
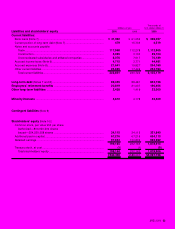
Financial Position Total assets decreased ¥47,642
million (US$449.5 million) to ¥540,359 million (US$5,097.7
million) as a result of efforts to reduce assets to improve asset
efficiency.
Total current assets declined ¥32,812 million (US$309.5
million), owing to a reduction in inventories and a decrease in
notes and accounts receivable. Total current liabilities de-
creased ¥17,893 million (US$168.8 million) as debt was re-
paid. As a result, working capital fell ¥14,919 million
(US$140.7 million) to ¥127,709 million (US$1,204.8 million)
compared with the previous fiscal year. The current ratio de-
creased from 1.59 to 1.57.
Interest-bearing debt decreased ¥33,370 million
(US$314.8 million) to ¥131,896 million (US$1,244.3 million).
Stockholders’ equity fell ¥32,998 million (US$311.3 million)
to ¥199,164 million (US$1,878.9 million) on account of a re-
duction in consolidated retained earnings in accordance with
the application of tax-effect accounting and the net loss
recorded during the term. Stockholders’ equity as a percent-
age of total assets was 36.9% compared with 39.5% in the
previous fiscal year. Stockholders’ equity per share was
¥783.41 (US$7.39).
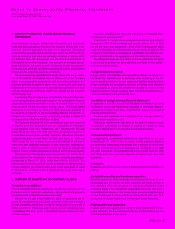
Forward-Looking Statements When included in
this annual report, the words “will,” “should,” “expects,”
“intends,” “anticipates,” “estimates,”and similar expressions,
among others, identify forward-looking statements. Such
statements are inherently subject to a variety of risks and
uncertainties that could cause actual results to differ materially
from those set forth in such statements. These forward-
looking statements are made only as of the date of this
annual report. The Company expressly disclaims any
obligations or undertaking to release any update or revision to
any forward-looking statement contained herein to reflect any
change in the Company’s expectations with regard thereto or
any change in events, conditions or circumstances on which
any statement is based.
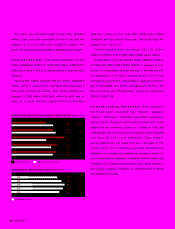
Stockholders’ Equity/Total Assets (Billions of yen)
562
604
624
588
540
1996
1997
1998
1999
2000
Capital Expenditures/Depreciation & Amortization (Billions of yen)
36.7
30.5
28.8
28.6
24.3
24.0
27.2
31.6
28.5
30.5 1996
1997
1998
1999
2000
248
250
243
232
199
Stockholders’ Equity
Capital Expenditures Depreciation & Amortization