JVC 2000 Annual Report Download - page 2
Download and view the complete annual report
Please find page 2 of the 2000 JVC annual report below. You can navigate through the pages in the report by either clicking on the pages listed below, or by using the keyword search tool below to find specific information within the annual report.-
 1
1 -
 2
2 -
 3
3 -
 4
4 -
 5
5 -
 6
6 -
 7
7 -
 8
8 -
 9
9 -
 10
10 -
 11
11 -
 12
12 -
 13
13 -
14
-
15
-
16
-
17
-
18
-
19
-
20
-
21
-
22
-
23
-
24
-
25
-
26
-
27
-
28
-
29
-
30
-
31
-
32
-
33
-
34
-
35
-
36
-
37
-
38
-
39
-
40
-
41
-
42
 |
 |

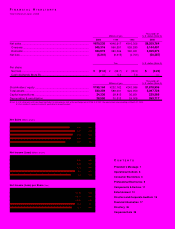
FINANCIAL HIGHLIGHTS
Victor Company of Japan, Limited
Thousands of
Millions of yen U.S. dollars (Note A)
2000 1999 1998 2000
Net sales........................................................................................ ¥870,235 ¥946,617 ¥916,306 $8,209,764
Overseas...................................................................................... 545,316 566,551 526,285 5,144,491
Domestic...................................................................................... 324,919 380,066 390,021 3,065,273
Net loss.......................................................................................... (5,341) (8,315) (4,703) (50,387)
Yen U.S. dollars (Note A)
Per share:
Net loss........................................................................................ ¥ (21.0) ¥ (32.7) ¥ (18.5) $ (0.20)
Cash dividends (Note B)............................................................... —5.0 7.0 —
Thousands of
Millions of yen U.S. dollars (Note A)
Stockholders’ equity ...................................................................... ¥199,164 ¥232,162 ¥243,086 $1,878,906
Total assets.................................................................................... 540,359 588,001 624,050 5,097,726
Capital expenditures ...................................................................... 24,336 28,815 36,651 229,585
Depreciation & amortization ........................................................... 28,590 30,513 24,008 269,717
Notes: A. U.S. dollar amounts have been translated, for convenience only, at the exchange rate of ¥106 to U.S.$1, the approximate rate prevailing on March 31, 2000.
B. Cash dividends represent amounts applicable to respective years.
Net Sales (Billions of yen)
807
890
916
947
870
1996
1997
1998
1999
2000
Net Income (Loss) (Billions of yen)
4.3
4.6
(4.7)
(8.3)
(5.3)
1996
1997
1998
1999
2000
Net Income (Loss) per Share (Yen)
17.1
18.0
(18.5)
(32.7)
(21.0)
1996
1997
1998
1999
2000
CONTENTS
President’s Message 1
Operational Outlook 6
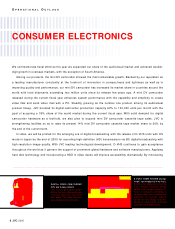
Consumer Electronics 6
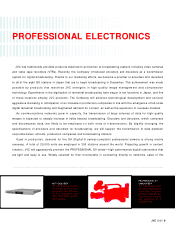
Professional Electronics 9
Components & Devices 11
Entertainment 13
Directors and Corporate Auditors 16
Financial Information 17
Directory 36
Corporate Data 39