HSBC 2009 Annual Report Download - page 82
Download and view the complete annual report
Please find page 82 of the 2009 HSBC annual report below. You can navigate through the pages in the report by either clicking on the pages listed below, or by using the keyword search tool below to find specific information within the annual report.-
 1
1 -
2
-
3
-
4
-
5
-
6
-
7
-
8
-
9
-
10
-
11
-
12
-
13
-
14
-
15
-
16
-
17
-
18
-
19
-
20
-
21
-
22
-
23
-
24
-
25
-
26
-
27
-
28
-
29
-
30
-
31
-
32
-
33
-
34
-
35
-
36
-
37
-
38
-
39
-
40
-
41
-
42
-
43
-
44
-
45
-
46
-
47
-
48
-
49
-
50
-
51
-
52
-
53
-
54
-
55
-
56
-
57
-
58
-
59
-
60
-
61
-
62
-
63
-
64
-
65
-
66
-
67
-
68
-
69
-
70
-
71
-
 72
72 -
 73
73 -
 74
74 -
 75
75 -
 76
76 -
 77
77 -
 78
78 -
 79
79 -
 80
80 -
 81
81 -
 82
82 -
 83
83 -
 84
84 -
 85
85 -
 86
86 -
 87
87 -
 88
88 -
 89
89 -
 90
90 -
 91
91 -
 92
92 -
93
-
94
-
95
-
96
-
97
-
98
-
99
-
100
-
101
-
102
-
103
-
104
-
105
-
106
-
107
-
108
-
109
-
110
-
111
-
112
-
113
-
114
-
115
-
116
-
117
-
118
-
119
-
120
-
121
-
122
-
123
-
124
-
125
-
126
-
127
-
128
-
129
-
130
-
131
-
132
-
133
-
134
-
135
-
136
-
137
-
138
-
139
-
140
-
141
-
142
-
143
-
144
-
145
-
146
-
147
-
148
-
149
-
150
-
151
-
152
-
153
-
154
-
155
-
156
-
157
-
158
-
159
-
160
-
161
-
162
-
163
-
164
-
165
-
166
-
167
-
168
-
169
-
170
-
171
-
172
-
173
-
174
-
175
-
176
-
177
-
178
-
179
-
180
-
181
-
182
-
183
-
184
-
185
-
186
-
187
-
188
-
189
-
190
-
191
-
192
-
193
-
194
-
195
-
196
-
197
-
198
-
199
-
200
-
201
-
202
-
203
-
204
-
205
-
206
-
207
-
208
-
209
-
210
-
211
-
212
-
213
-
214
-
215
-
216
-
217
-
218
-
219
-
220
-
221
-
222
-
223
-
224
-
225
-
226
-
227
-
228
-
229
-
230
-
231
-
232
-
233
-
234
-
235
-
236
-
237
-
238
-
239
-
240
-
241
-
242
-
243
-
244
-
245
-
246
-
247
-
248
-
249
-
250
-
251
-
252
-
253
-
254
-
255
-
256
-
257
-
258
-
259
-
260
-
261
-
262
-
263
-
264
-
265
-
266
-
267
-
268
-
269
-
270
-
271
-
272
-
273
-
274
-
275
-
276
-
277
-
278
-
279
-
280
-
281
-
282
-
283
-
284
-
285
-
286
-
287
-
288
-
289
-
290
-
291
-
292
-
293
-
294
-
295
-
296
-
297
-
298
-
299
-
300
-
301
-
302
-
303
-
304
-
305
-
306
-
307
-
308
-
309
-
310
-
311
-
312
-
313
-
314
-
315
-
316
-
317
-
318
-
319
-
320
-
321
-
322
-
323
-
324
-
325
-
326
-
327
-
328
-
329
-
330
-
331
-
332
-
333
-
334
-
335
-
336
-
337
-
338
-
339
-
340
-
341
-
342
-
343
-
344
-
345
-
346
-
347
-
348
-
349
-
350
-
351
-
352
-
353
-
354
-
355
-
356
-
357
-
358
-
359
-
360
-
361
-
362
-
363
-
364
-
365
-
366
-
367
-
368
-
369
-
370
-
371
-
372
-
373
-
374
-
375
-
376
-
377
-
378
-
379
-
380
-
381
-
382
-
383
-
384
-
385
-
386
-
387
-
388
-
389
-
390
-
391
-
392
-
393
-
394
-
395
-
396
-
397
-
398
-
399
-
400
-
401
-
402
-
403
-
404
-
405
-
406
-
407
-
408
-
409
-
410
-
411
-
412
-
413
-
414
-
415
-
416
-
417
-
418
-
419
-
420
-
421
-
422
-
423
-
424
-
425
-
426
-
427
-
428
-
429
-
430
-
431
-
432
-
433
-
434
-
435
-
436
-
437
-
438
-
439
-
440
-
441
-
442
-
443
-
444
-
445
-
446
-
447
-
448
-
449
-
450
-
451
-
452
-
453
-
454
-
455
-
456
-
457
-
458
-
459
-
460
-
461
-
462
-
463
-
464
-
465
-
466
-
467
-
468
-
469
-
470
-
471
-
472
-
473
-
474
-
475
-
476
-
477
-
478
-
479
-
480
-
481
-
482
-
483
-
484
-
485
-
486
-
487
-
488
-
489
-
490
-
491
-
492
-
493
-
494
-
495
-
496
-
497
-
498
-
499
-
500
-
501
-
502
-
503
-
504
 |
 |

HSBC HOLDINGS PLC
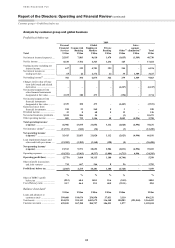
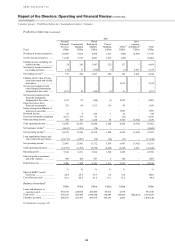
Report of the Directors: Operating and Financial Review (continued)
Customer groups > Other
80
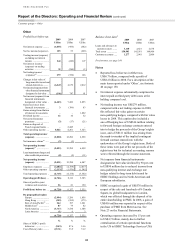
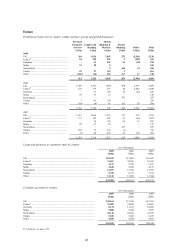
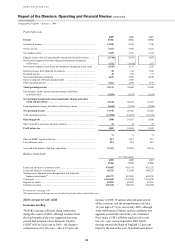
Other
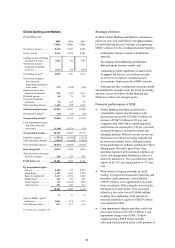
Profit/(loss) before tax
2009 2008 2007
US$m US$m US$m
Net interest expense .......... (1,035) (956) (542)
Net fee income/(expense) .. 125 53 (228)
Trading income/(expense)
excluding net interest
income ............................ 244 (262) 127
Net interest income/
(expense) on trading
activities ......................... 35 (268) (1)
Net trading income/
(expense)42 .................... 279 (530) 126
Changes in fair value of
long-term debt issued and
related derivatives .......... (6,247) 6,679 2,812
Net income/(expense) from
other financial instruments
designated at fair value ... (196) 747 81
Net income/(expense) from
financial instruments
designated at fair value .. (6,443) 7,426 2,893
Gains less losses from
financial investments ..... 3 (396) 83
Gains arising from dilution
of interests in associates – – 1,092
Dividend income ............... 12 10 32
Net earned insurance
premiums ....................... (3) (17) (21)
Gains on disposal of
French regional banks .... – 2,445 –
Other operating income .... 5,042 4,261 3,523
Total operating income/
(expense) ....................... (2,020) 12,296 6,958
Net insurance claims43 ...... (3) (1) –
Net operating income/
(expense)16 ..................... (2,023) 12,295 6,958
Loan impairment charges and
other credit risk provisions (8) (5) (11)
Net operating income/
(expense) ...................... (2,031) 12,290 6,947
Employee expenses .......... (2,602) (2,198) (2,017)
Other operating expenses . (2,113) (1,976) (1,545)
Total operating expenses .. (4,715) (4,174) (3,562)
Operating profit/(loss) .... (6,746) 8,116 3,385
Share of profit in joint
ventures and associates .. 26 41 150
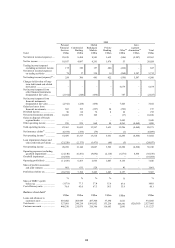
Profit/(loss) before tax .... (6,720) 8,157 3,535
By geographical region
Europe ............................ (2,994) 5,296 1,056
Hong Kong ..................... (359) (955) (375)
Rest of Asia-Pacific27 ..... 264 197 1,261
Middle East27 ................. 87 79 82
North America ............... (3,717) 3,534 1,508
Latin America ................ (1) 6 3
(6,720) 8,157 3,535
% % %
Share of HSBC’s profit
before tax ....................... (94.9)
87.6 14.6
Cost efficiency ratio .......... (233.1) 33.9 51.2
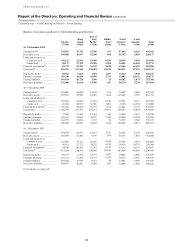
Balance sheet data41
2009 2008 2007
US$m US$m US$m
Loans and advances to
customers (net) ........ 3,110 2,621 2,678
Total assets ................. 150,983 145,581 164,806
Customer accounts ..... 1,277 2,041 2,006
For footnotes, see page 149.
Notes
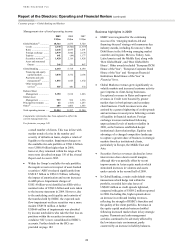
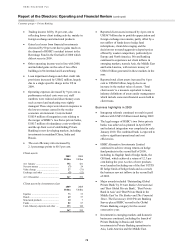
• Reported loss before tax in Other was
US$6.7 billion, compared with a profit of
US$8.2 billion in 2008. For a description of the
main items reported under ‘Other’, see footnote
40 on page 150.
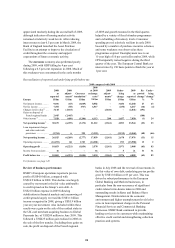
• Net interest expense substantially comprises the
interest paid on third-party debt issues at the
holding company level.
• Net trading income was US$279 million,
compared with a net trading expense in 2008;
this reflected fair value gains on certain
non-qualifying hedges, compared with fair value
losses in 2008. This caption also included a
one-off hedging loss of US$344 million relating
to forward foreign exchange contracts entered
into to hedge the proceeds of the Group’s rights
issue, and a US$121 million loss arising from
the mark-to-market of the implied contingent
forward contract entered into with the
underwriters of the Group’s rights issue. Both of
these items were part of the net proceeds of the
rights issue but for technical accounting reasons
were reflected through the income statement.
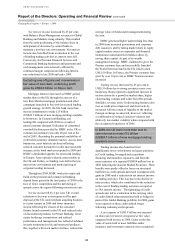
• Net expense from financial instruments
designated at fair value declined by 90 per cent
to US$90 million due to reduced income from
non-qualifying interest and exchange rate
hedges related to long-term debt issued by
HSBC Holdings and its North American and
European subsidiaries.
• HSBC recognised a gain of US$576 million in
respect of the sale and leaseback of 8 Canada
Square, its global headquarters in London,
which was effected through the disposal of its
entire shareholding in PMII. In 2008, a gain of
US$416 million was reported in respect of the
purchase of PMII from Metrovacesa. See
Note 23 on the Financial Statements.
• Operating expenses increased by 15 per cent
to US$4.7 billion, mainly due to further
centralisation of certain operational functions
in the US to HSBC Technology Services USA