HSBC 2009 Annual Report Download - page 255
Download and view the complete annual report
Please find page 255 of the 2009 HSBC annual report below. You can navigate through the pages in the report by either clicking on the pages listed below, or by using the keyword search tool below to find specific information within the annual report.-
 1
1 -
2
-
3
-
4
-
5
-
6
-
7
-
8
-
9
-
10
-
11
-
12
-
13
-
14
-
15
-
16
-
17
-
18
-
19
-
20
-
21
-
22
-
23
-
24
-
25
-
26
-
27
-
28
-
29
-
30
-
31
-
32
-
33
-
34
-
35
-
36
-
37
-
38
-
39
-
40
-
41
-
42
-
43
-
44
-
45
-
46
-
47
-
48
-
49
-
50
-
51
-
52
-
53
-
54
-
55
-
56
-
57
-
58
-
59
-
60
-
61
-
62
-
63
-
64
-
65
-
66
-
67
-
68
-
69
-
70
-
71
-
72
-
73
-
74
-
75
-
76
-
77
-
78
-
79
-
80
-
81
-
82
-
83
-
84
-
85
-
86
-
87
-
88
-
89
-
90
-
91
-
92
-
93
-
94
-
95
-
96
-
97
-
98
-
99
-
100
-
101
-
102
-
103
-
104
-
105
-
106
-
107
-
108
-
109
-
110
-
111
-
112
-
113
-
114
-
115
-
116
-
117
-
118
-
119
-
120
-
121
-
122
-
123
-
124
-
125
-
126
-
127
-
128
-
129
-
130
-
131
-
132
-
133
-
134
-
135
-
136
-
137
-
138
-
139
-
140
-
141
-
142
-
143
-
144
-
145
-
146
-
147
-
148
-
149
-
150
-
151
-
152
-
153
-
154
-
155
-
156
-
157
-
158
-
159
-
160
-
161
-
162
-
163
-
164
-
165
-
166
-
167
-
168
-
169
-
170
-
171
-
172
-
173
-
174
-
175
-
176
-
177
-
178
-
179
-
180
-
181
-
182
-
183
-
184
-
185
-
186
-
187
-
188
-
189
-
190
-
191
-
192
-
193
-
194
-
195
-
196
-
197
-
198
-
199
-
200
-
201
-
202
-
203
-
204
-
205
-
206
-
207
-
208
-
209
-
210
-
211
-
212
-
213
-
214
-
215
-
216
-
217
-
218
-
219
-
220
-
221
-
222
-
223
-
224
-
225
-
226
-
227
-
228
-
229
-
230
-
231
-
232
-
233
-
234
-
235
-
236
-
237
-
238
-
239
-
240
-
241
-
242
-
243
-
244
-
 245
245 -
 246
246 -
 247
247 -
 248
248 -
 249
249 -
 250
250 -
 251
251 -
 252
252 -
 253
253 -
 254
254 -
 255
255 -
 256
256 -
 257
257 -
 258
258 -
 259
259 -
 260
260 -
 261
261 -
 262
262 -
 263
263 -
 264
264 -
 265
265 -
266
-
267
-
268
-
269
-
270
-
271
-
272
-
273
-
274
-
275
-
276
-
277
-
278
-
279
-
280
-
281
-
282
-
283
-
284
-
285
-
286
-
287
-
288
-
289
-
290
-
291
-
292
-
293
-
294
-
295
-
296
-
297
-
298
-
299
-
300
-
301
-
302
-
303
-
304
-
305
-
306
-
307
-
308
-
309
-
310
-
311
-
312
-
313
-
314
-
315
-
316
-
317
-
318
-
319
-
320
-
321
-
322
-
323
-
324
-
325
-
326
-
327
-
328
-
329
-
330
-
331
-
332
-
333
-
334
-
335
-
336
-
337
-
338
-
339
-
340
-
341
-
342
-
343
-
344
-
345
-
346
-
347
-
348
-
349
-
350
-
351
-
352
-
353
-
354
-
355
-
356
-
357
-
358
-
359
-
360
-
361
-
362
-
363
-
364
-
365
-
366
-
367
-
368
-
369
-
370
-
371
-
372
-
373
-
374
-
375
-
376
-
377
-
378
-
379
-
380
-
381
-
382
-
383
-
384
-
385
-
386
-
387
-
388
-
389
-
390
-
391
-
392
-
393
-
394
-
395
-
396
-
397
-
398
-
399
-
400
-
401
-
402
-
403
-
404
-
405
-
406
-
407
-
408
-
409
-
410
-
411
-
412
-
413
-
414
-
415
-
416
-
417
-
418
-
419
-
420
-
421
-
422
-
423
-
424
-
425
-
426
-
427
-
428
-
429
-
430
-
431
-
432
-
433
-
434
-
435
-
436
-
437
-
438
-
439
-
440
-
441
-
442
-
443
-
444
-
445
-
446
-
447
-
448
-
449
-
450
-
451
-
452
-
453
-
454
-
455
-
456
-
457
-
458
-
459
-
460
-
461
-
462
-
463
-
464
-
465
-
466
-
467
-
468
-
469
-
470
-
471
-
472
-
473
-
474
-
475
-
476
-
477
-
478
-
479
-
480
-
481
-
482
-
483
-
484
-
485
-
486
-
487
-
488
-
489
-
490
-
491
-
492
-
493
-
494
-
495
-
496
-
497
-
498
-
499
-
500
-
501
-
502
-
503
-
504
 |
 |
253
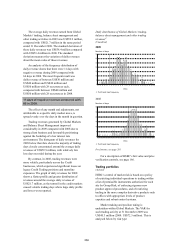
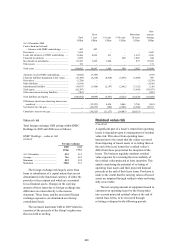
The average daily revenue earned from Global
Markets’ trading, balance sheet management and
other trading activities in 2009 was US$59.9 million,
compared with US$21.7 million in the same period
ended 31 December 2008. The standard deviation of
these daily revenues was US$38.4 million compared
with US$53.4 million in 2008. The standard
deviation measures the variation of daily revenues
about the mean value of those revenues.
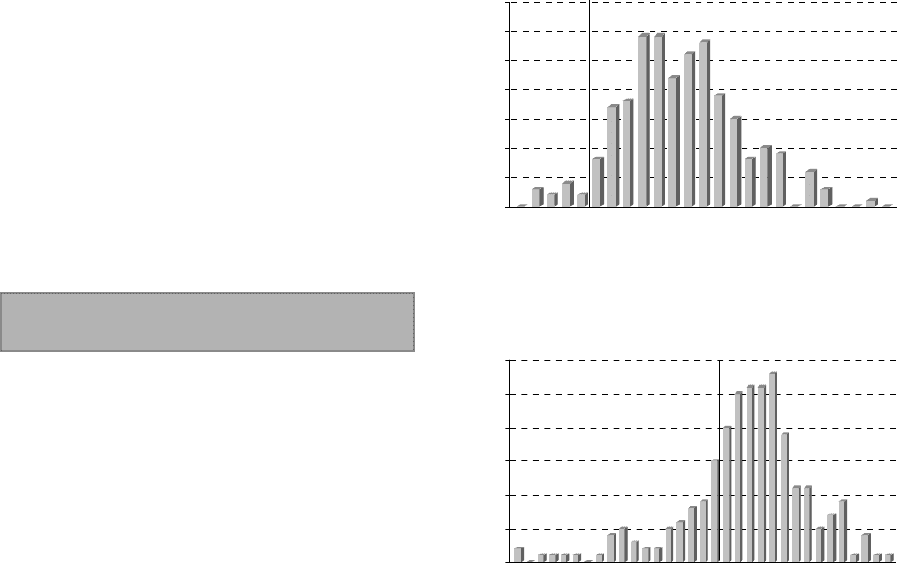
An analysis of the frequency distribution of
daily revenue shows that there were 11 days with
negative revenue during 2009 compared with
66 days in 2008. The most frequent result was
daily revenue of between US$30 million and
US$40 million and US$40 million and
US$50 million with 29 occurrences each,
compared with between US$40 million and
US$50 million with 28 occurrences in 2008.
11 days of negative revenue compared with
66 in 2008.
The effect of any month end adjustments, not
attributable to a specific daily market move, is
spread evenly over the days in the month in question.
Trading revenues generated by Global Markets
and Balance Sheet Management improved
considerably in 2009 compared with 2008 due to
strong client business and favourable positioning
against the backdrop of a low interest rate
environment. The histogram of daily revenues for
2009 below therefore shows the majority of trading
days closely concentrated around the average daily
revenues of US$59.9 million, with relatively few
loss days recorded during the year.
By contrast, in 2008, trading revenues were
more volatile, particularly across the Credit
businesses, which experienced significant losses on
legacy Credit Trading positions and monoline
exposures. The graph of daily revenues for 2008
shows a flatter profile and greater distribution of
revenues around the average daily revenue of
US$21.7 million, as the turmoil in the credit markets
caused volatile trading days where large daily profits
and losses were reported.
Daily distribution of Global Markets’ trading,
balance sheet management and other trading
revenues47
(Unaudited)
2009
Number of days
0
32
4
2
8
17
18
29 29
22
26
28
19
15
810
9
0
6
3
00
1
0
0
5
10
15
20
25
30
35
-50 -40 -30 -20 -10 0 10 20 30 40 50 60 70 80 90 100 110 120 130 140 150 160 170 180 190 200
US$m
Profit and loss frequency
2008
Number of days
2
0111101
45
32 2
56
8
9
15
20
25 26 26
28
19
11 11
5
7
9
1
4
1 1
0
5
10
15
20
25
30
-180-170-160-150-140-130-120-110-100 -90 -8 0 -70 -60 -5 0 -40 -30 -2 0 -10 0 10 20 30 40 50 60 70 80 90 100 110 120 130 140 150
US$m
Profit and loss frequency
For footnote, see page 291.
For a description of HSBC’s fair value and price
verification controls, see page 166.
Trading portfolios
(Audited)
HSBC’s control of market risk is based on a policy
of restricting individual operations to trading within
a list of permissible instruments authorised for each
site by Group Risk, of enforcing rigorous new
product approval procedures, and of restricting
trading in the more complex derivative products only
to offices with appropriate levels of product
expertise and robust control systems.
Market making and position taking is
undertaken within Global Markets. The VAR for
such trading activity at 31 December 2009 was
US$45.3 million (2008: US$72.5 million). This is
analysed below by risk type: