HSBC 2009 Annual Report Download - page 72
Download and view the complete annual report
Please find page 72 of the 2009 HSBC annual report below. You can navigate through the pages in the report by either clicking on the pages listed below, or by using the keyword search tool below to find specific information within the annual report.-
 1
1 -
2
-
3
-
4
-
5
-
6
-
7
-
8
-
9
-
10
-
11
-
12
-
13
-
14
-
15
-
16
-
17
-
18
-
19
-
20
-
21
-
22
-
23
-
24
-
25
-
26
-
27
-
28
-
29
-
30
-
31
-
32
-
33
-
34
-
35
-
36
-
37
-
38
-
39
-
40
-
41
-
42
-
43
-
44
-
45
-
46
-
47
-
48
-
49
-
50
-
51
-
52
-
53
-
54
-
55
-
56
-
57
-
58
-
59
-
60
-
61
-
 62
62 -
 63
63 -
 64
64 -
 65
65 -
 66
66 -
 67
67 -
 68
68 -
 69
69 -
 70
70 -
 71
71 -
 72
72 -
 73
73 -
 74
74 -
 75
75 -
 76
76 -
 77
77 -
 78
78 -
 79
79 -
 80
80 -
 81
81 -
 82
82 -
83
-
84
-
85
-
86
-
87
-
88
-
89
-
90
-
91
-
92
-
93
-
94
-
95
-
96
-
97
-
98
-
99
-
100
-
101
-
102
-
103
-
104
-
105
-
106
-
107
-
108
-
109
-
110
-
111
-
112
-
113
-
114
-
115
-
116
-
117
-
118
-
119
-
120
-
121
-
122
-
123
-
124
-
125
-
126
-
127
-
128
-
129
-
130
-
131
-
132
-
133
-
134
-
135
-
136
-
137
-
138
-
139
-
140
-
141
-
142
-
143
-
144
-
145
-
146
-
147
-
148
-
149
-
150
-
151
-
152
-
153
-
154
-
155
-
156
-
157
-
158
-
159
-
160
-
161
-
162
-
163
-
164
-
165
-
166
-
167
-
168
-
169
-
170
-
171
-
172
-
173
-
174
-
175
-
176
-
177
-
178
-
179
-
180
-
181
-
182
-
183
-
184
-
185
-
186
-
187
-
188
-
189
-
190
-
191
-
192
-
193
-
194
-
195
-
196
-
197
-
198
-
199
-
200
-
201
-
202
-
203
-
204
-
205
-
206
-
207
-
208
-
209
-
210
-
211
-
212
-
213
-
214
-
215
-
216
-
217
-
218
-
219
-
220
-
221
-
222
-
223
-
224
-
225
-
226
-
227
-
228
-
229
-
230
-
231
-
232
-
233
-
234
-
235
-
236
-
237
-
238
-
239
-
240
-
241
-
242
-
243
-
244
-
245
-
246
-
247
-
248
-
249
-
250
-
251
-
252
-
253
-
254
-
255
-
256
-
257
-
258
-
259
-
260
-
261
-
262
-
263
-
264
-
265
-
266
-
267
-
268
-
269
-
270
-
271
-
272
-
273
-
274
-
275
-
276
-
277
-
278
-
279
-
280
-
281
-
282
-
283
-
284
-
285
-
286
-
287
-
288
-
289
-
290
-
291
-
292
-
293
-
294
-
295
-
296
-
297
-
298
-
299
-
300
-
301
-
302
-
303
-
304
-
305
-
306
-
307
-
308
-
309
-
310
-
311
-
312
-
313
-
314
-
315
-
316
-
317
-
318
-
319
-
320
-
321
-
322
-
323
-
324
-
325
-
326
-
327
-
328
-
329
-
330
-
331
-
332
-
333
-
334
-
335
-
336
-
337
-
338
-
339
-
340
-
341
-
342
-
343
-
344
-
345
-
346
-
347
-
348
-
349
-
350
-
351
-
352
-
353
-
354
-
355
-
356
-
357
-
358
-
359
-
360
-
361
-
362
-
363
-
364
-
365
-
366
-
367
-
368
-
369
-
370
-
371
-
372
-
373
-
374
-
375
-
376
-
377
-
378
-
379
-
380
-
381
-
382
-
383
-
384
-
385
-
386
-
387
-
388
-
389
-
390
-
391
-
392
-
393
-
394
-
395
-
396
-
397
-
398
-
399
-
400
-
401
-
402
-
403
-
404
-
405
-
406
-
407
-
408
-
409
-
410
-
411
-
412
-
413
-
414
-
415
-
416
-
417
-
418
-
419
-
420
-
421
-
422
-
423
-
424
-
425
-
426
-
427
-
428
-
429
-
430
-
431
-
432
-
433
-
434
-
435
-
436
-
437
-
438
-
439
-
440
-
441
-
442
-
443
-
444
-
445
-
446
-
447
-
448
-
449
-
450
-
451
-
452
-
453
-
454
-
455
-
456
-
457
-
458
-
459
-
460
-
461
-
462
-
463
-
464
-
465
-
466
-
467
-
468
-
469
-
470
-
471
-
472
-
473
-
474
-
475
-
476
-
477
-
478
-
479
-
480
-
481
-
482
-
483
-
484
-
485
-
486
-
487
-
488
-
489
-
490
-
491
-
492
-
493
-
494
-
495
-
496
-
497
-
498
-
499
-
500
-
501
-
502
-
503
-
504
 |
 |

HSBC HOLDINGS PLC
Report of the Directors: Operating and Financial Review (continued)
Customer groups > Commercial Banking
70
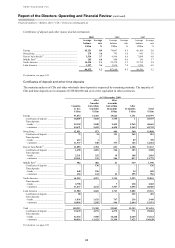
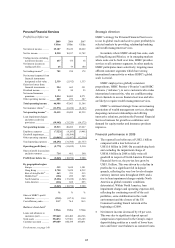
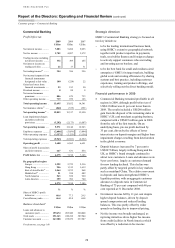
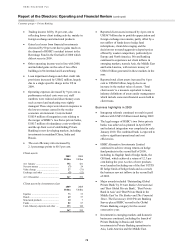
Commercial Banking
Profit before tax
2009 2008 2007
US$m US$m US$m
Net interest income ........... 7,883 9,494 9,055
Net fee income .................. 3,702 4,097 3,972
Trading income excluding
net interest income ......... 332 369 265
Net interest income on
trading activities ............. 22 17 31
Net trading income42 ......... 354 386 296
Net income/(expense) from
financial instruments
designated at fair value .. 100 (224) 22
Gains less losses from
financial investments ..... 23 193 90
Dividend income ............... 8 88 8
Net earned insurance
premiums ....................... 886 679 733
Other operating income .... 739 939 165
Total operating income .. 13,695 15,652 14,341
Net insurance claims43 ...... (842) (335) (391)
Net operating income16 ... 12,853 15,317 13,950
Loan impairment charges
and other credit risk
provisions ....................... (3,282) (2,173) (1,007)
Net operating income ..... 9,571 13,144 12,943
Employee expenses .......... (2,606) (3,056) (3,094)
Other operating expenses . (3,357) (3,525) (3,158)
Total operating expenses .. (5,963) (6,581) (6,252)
Operating profit .............. 3,608 6,563 6,691
Share of profit in associates
and joint ventures ........... 667 631 454
Profit before tax .............. 4,275 7,194 7,145
By geographical region
Europe ............................ 1,292 2,722 2,516
Hong Kong ..................... 956 1,315 1,619
Rest of Asia-Pacific27 ..... 1,064 1,235 868
Middle East27 ................. 21 558 482
North America ............... 543 658 920
Latin America ................ 399 706 740
4,275 7,194 7,145
% % %
Share of HSBC’s profit
before tax ....................... 60.4
77.3 29.5
Cost efficiency ratio .......... 46.4 43.0 44.8
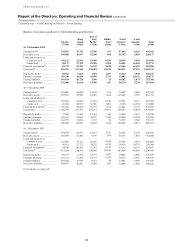
Balance sheet data41
US$m US$m US$m
Loans and advances to
customers (net) ............... 199,674 203,949 220,068
Total assets ........................ 251,143 249,218 307,944
Customer accounts ............ 267,388 235,879 237,987
For footnotes, see page 149.
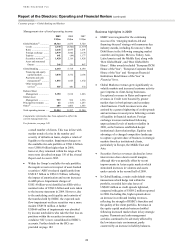
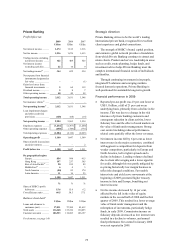
Strategic direction
HSBC’s Commercial Banking strategy is focused on
two key initiatives:
− to be the leading international business bank,
using HSBC’s extensive geographical network
together with product expertise in payments,
trade, receivables finance and foreign exchange
to actively support customers who are trading
and investing across borders; and
− to be the best bank for small and medium-sized
enterprises (‘SME’s) in target markets, building
global scale and creating efficiencies by sharing
systems and best practice, including customer
experience, training and product offerings, and
selectively rolling out the direct banking model.
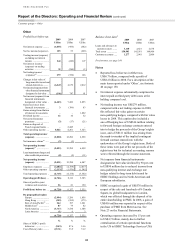
Financial performance in 2009
• Commercial Banking remained profitable in all
regions in 2009, although profit before tax of
US$4.3 billion was 41 per cent lower than in
2008. The results included a US$280 million
gain from the disposal of the remaining stake in
HSBC’s UK card merchant acquiring business,
compared with a US$425 million gain in 2008
from the sale of the first tranche. On an
underlying basis, pre-tax profit declined by
35 per cent, driven by the effects of lower
interest rates on deposit margins and higher loan
impairment charges resulting from deterioration
in the global economy.
• Deposit balances increased by 7 per cent to
US$267 billion, largely in Hong Kong and the
UK, as HSBC’s brand strength continued to
attract new customers. Loans and advances were
9 per cent lower, largely as customer demand
for new lending declined. This decline was
partly offset by targeted growth in key markets
such as mainland China. The relative movement
in deposits and loans strengthened HSBC’s
liquidity position, with an aggregate customer
advances to deposits ratio in Commercial
Banking of 75 per cent compared with 86 per
cent reported at 31 December 2008.
• Net interest income fell by 11 per cent despite
higher deposit balances, driven by deposit
spread compression and reduced lending
balances. This was partly offset by wider
spreads on lending due to improved pricing.
• Net fee income was broadly unchanged, as
repricing initiatives drove higher fee income
from credit facilities in North America which
was offset by a reduction in fee income