HSBC 2009 Annual Report Download - page 276
Download and view the complete annual report
Please find page 276 of the 2009 HSBC annual report below. You can navigate through the pages in the report by either clicking on the pages listed below, or by using the keyword search tool below to find specific information within the annual report.-
 1
1 -
2
-
3
-
4
-
5
-
6
-
7
-
8
-
9
-
10
-
11
-
12
-
13
-
14
-
15
-
16
-
17
-
18
-
19
-
20
-
21
-
22
-
23
-
24
-
25
-
26
-
27
-
28
-
29
-
30
-
31
-
32
-
33
-
34
-
35
-
36
-
37
-
38
-
39
-
40
-
41
-
42
-
43
-
44
-
45
-
46
-
47
-
48
-
49
-
50
-
51
-
52
-
53
-
54
-
55
-
56
-
57
-
58
-
59
-
60
-
61
-
62
-
63
-
64
-
65
-
66
-
67
-
68
-
69
-
70
-
71
-
72
-
73
-
74
-
75
-
76
-
77
-
78
-
79
-
80
-
81
-
82
-
83
-
84
-
85
-
86
-
87
-
88
-
89
-
90
-
91
-
92
-
93
-
94
-
95
-
96
-
97
-
98
-
99
-
100
-
101
-
102
-
103
-
104
-
105
-
106
-
107
-
108
-
109
-
110
-
111
-
112
-
113
-
114
-
115
-
116
-
117
-
118
-
119
-
120
-
121
-
122
-
123
-
124
-
125
-
126
-
127
-
128
-
129
-
130
-
131
-
132
-
133
-
134
-
135
-
136
-
137
-
138
-
139
-
140
-
141
-
142
-
143
-
144
-
145
-
146
-
147
-
148
-
149
-
150
-
151
-
152
-
153
-
154
-
155
-
156
-
157
-
158
-
159
-
160
-
161
-
162
-
163
-
164
-
165
-
166
-
167
-
168
-
169
-
170
-
171
-
172
-
173
-
174
-
175
-
176
-
177
-
178
-
179
-
180
-
181
-
182
-
183
-
184
-
185
-
186
-
187
-
188
-
189
-
190
-
191
-
192
-
193
-
194
-
195
-
196
-
197
-
198
-
199
-
200
-
201
-
202
-
203
-
204
-
205
-
206
-
207
-
208
-
209
-
210
-
211
-
212
-
213
-
214
-
215
-
216
-
217
-
218
-
219
-
220
-
221
-
222
-
223
-
224
-
225
-
226
-
227
-
228
-
229
-
230
-
231
-
232
-
233
-
234
-
235
-
236
-
237
-
238
-
239
-
240
-
241
-
242
-
243
-
244
-
245
-
246
-
247
-
248
-
249
-
250
-
251
-
252
-
253
-
254
-
255
-
256
-
257
-
258
-
259
-
260
-
261
-
262
-
263
-
264
-
265
-
 266
266 -
 267
267 -
 268
268 -
 269
269 -
 270
270 -
 271
271 -
 272
272 -
 273
273 -
 274
274 -
 275
275 -
 276
276 -
 277
277 -
 278
278 -
 279
279 -
 280
280 -
 281
281 -
 282
282 -
 283
283 -
 284
284 -
 285
285 -
 286
286 -
287
-
288
-
289
-
290
-
291
-
292
-
293
-
294
-
295
-
296
-
297
-
298
-
299
-
300
-
301
-
302
-
303
-
304
-
305
-
306
-
307
-
308
-
309
-
310
-
311
-
312
-
313
-
314
-
315
-
316
-
317
-
318
-
319
-
320
-
321
-
322
-
323
-
324
-
325
-
326
-
327
-
328
-
329
-
330
-
331
-
332
-
333
-
334
-
335
-
336
-
337
-
338
-
339
-
340
-
341
-
342
-
343
-
344
-
345
-
346
-
347
-
348
-
349
-
350
-
351
-
352
-
353
-
354
-
355
-
356
-
357
-
358
-
359
-
360
-
361
-
362
-
363
-
364
-
365
-
366
-
367
-
368
-
369
-
370
-
371
-
372
-
373
-
374
-
375
-
376
-
377
-
378
-
379
-
380
-
381
-
382
-
383
-
384
-
385
-
386
-
387
-
388
-
389
-
390
-
391
-
392
-
393
-
394
-
395
-
396
-
397
-
398
-
399
-
400
-
401
-
402
-
403
-
404
-
405
-
406
-
407
-
408
-
409
-
410
-
411
-
412
-
413
-
414
-
415
-
416
-
417
-
418
-
419
-
420
-
421
-
422
-
423
-
424
-
425
-
426
-
427
-
428
-
429
-
430
-
431
-
432
-
433
-
434
-
435
-
436
-
437
-
438
-
439
-
440
-
441
-
442
-
443
-
444
-
445
-
446
-
447
-
448
-
449
-
450
-
451
-
452
-
453
-
454
-
455
-
456
-
457
-
458
-
459
-
460
-
461
-
462
-
463
-
464
-
465
-
466
-
467
-
468
-
469
-
470
-
471
-
472
-
473
-
474
-
475
-
476
-
477
-
478
-
479
-
480
-
481
-
482
-
483
-
484
-
485
-
486
-
487
-
488
-
489
-
490
-
491
-
492
-
493
-
494
-
495
-
496
-
497
-
498
-
499
-
500
-
501
-
502
-
503
-
504
 |
 |

HSBC HOLDINGS PLC
Report of the Directors: Risk (continued)
Insurance operations > Financial risks > Market risk
274
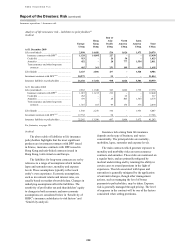
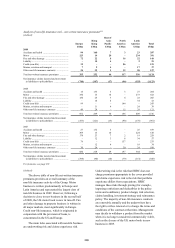
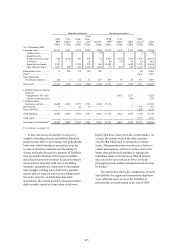
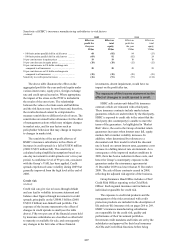
The table demonstrates that for linked contracts,
HSBC typically designates assets at fair value. For
non-linked contracts, the classification of the assets
is driven by the nature of the underlying contract.
The table also shows that approximately
64.4 per cent of financial assets were invested in
debt securities at 31 December 2009 (2008: 62.9 per
cent) with 22.2 per cent (2008: 19.7 per cent)
invested in equity securities.
In life linked insurance, premium income less
charges levied is invested in a portfolio of assets.
HSBC manages the financial risks of this product on
behalf of the policyholders by holding appropriate
assets in segregated funds or portfolios to which the
liabilities are linked. Typically, HSBC retains some
exposure to market risk as the market value of the
linked assets influences the fees charged by HSBC
and thereby affects the recoverability of expenses
incurred by the Group in managing the product. The
assets held to support life linked liabilities
represented 22.4 per cent of the total financial assets
of HSBC’s insurance manufacturing subsidiaries at
the end of 2009 (2008: 19.4 per cent).
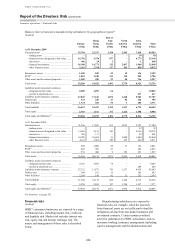
Market risk
(Audited)
Insurance and investment products manufactured
by HSBC’s insurance manufacturing subsidiaries
typically comprise features or combinations of
features which may not be easily or exactly
replicated by investments. Market risk arises when
mismatches occur between product liabilities and
the investment assets which back them; for example,
mismatches between asset and liability yields and
maturities give rise to interest rate risk.
Description of market risk
(Audited)
The main features of products manufactured by
HSBC’s insurance manufacturing subsidiaries which
generate market risk, and the market risk to which
these features expose the subsidiaries, are discussed
below.
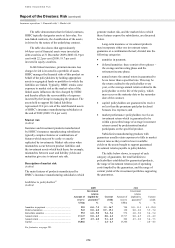
Long-term insurance or investment products
may incorporate either one investment return
guarantee or a combination thereof, divided into the
following categories:
• annuities in payment;
• deferred annuities: these consist of two phases –
the savings and investing phase and the
retirement income phase;
• annual return: the annual return is guaranteed to
be no lower than a specified rate. This may be
the return credited to the policyholder every
year, or the average annual return credited to the
policyholder over the life of the policy, which
may occur on the maturity date or the surrender
date of the contract;
• capital: policyholders are guaranteed to receive
no less than the premiums paid plus declared
bonuses less expenses; and
• market performance: policyholders receive an
investment return which is guaranteed to be
within a prescribed range of average investment
returns earned by predetermined market
participants on the specified product.
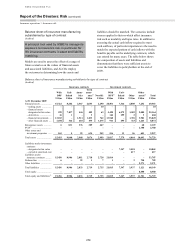
Subsidiaries manufacturing products with
guarantees usually retain exposures to falls in market
interest rates as they result in lower available
yields on the assets bought to support guaranteed
investment returns payable to policyholders.
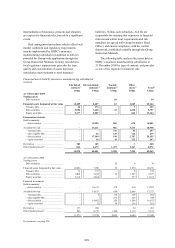
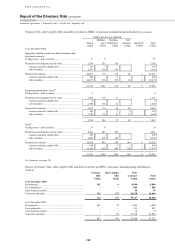
The table below shows, in respect of each
category of guarantee, the total liabilities to
policyholders established for guaranteed products,
the range of investment returns (net of operating
costs) implied by the guarantees, and the range of
current yields of the investment portfolios supporting
the guarantees.
Liabilities to policyholders62
(Audited)
2009 2008
Amount of
reserve
Investment
returns
implied by
guarantee63
Current
yields
Amount of
reserve
Investment
returns
implied by
guarantee63
Current
yields
US$m % % US$m % %
Annuities in payment .......................................... 925 0.0 – 7.5 1.3 – 16.7 744 0.0 – 11.5 6.5 – 28.0
Deferred annuities ............................................... 943 0.0 – 6.0 0.9 – 15.1 120 0.0 – 6.0 3.9 – 7.4
Immediate annuities ............................................ 553 6.0 – 9.0 5.4 – 5.4 576 6.0 – 9.0 5.4 – 5.4
Annual return ...................................................... 17,147 0.0 – 4.5 0.8 – 6.2 13,717 0.0 – 4.5 2.2 – 4.9
Annual return ...................................................... 497 4.5 – 6.0 5.1 – 6.5 302 4.5 – 6.0 3.4 – 7.3
Capital ................................................................. 15,866 – 2.4 – 4.3 13,346 – 2.0 – 4.3
For footnotes, see page 291.