HSBC 2009 Annual Report Download - page 104
Download and view the complete annual report
Please find page 104 of the 2009 HSBC annual report below. You can navigate through the pages in the report by either clicking on the pages listed below, or by using the keyword search tool below to find specific information within the annual report.-
 1
1 -
2
-
3
-
4
-
5
-
6
-
7
-
8
-
9
-
10
-
11
-
12
-
13
-
14
-
15
-
16
-
17
-
18
-
19
-
20
-
21
-
22
-
23
-
24
-
25
-
26
-
27
-
28
-
29
-
30
-
31
-
32
-
33
-
34
-
35
-
36
-
37
-
38
-
39
-
40
-
41
-
42
-
43
-
44
-
45
-
46
-
47
-
48
-
49
-
50
-
51
-
52
-
53
-
54
-
55
-
56
-
57
-
58
-
59
-
60
-
61
-
62
-
63
-
64
-
65
-
66
-
67
-
68
-
69
-
70
-
71
-
72
-
73
-
74
-
75
-
76
-
77
-
78
-
79
-
80
-
81
-
82
-
83
-
84
-
85
-
86
-
87
-
88
-
89
-
90
-
91
-
92
-
93
-
 94
94 -
 95
95 -
 96
96 -
 97
97 -
 98
98 -
 99
99 -
 100
100 -
 101
101 -
 102
102 -
 103
103 -
 104
104 -
 105
105 -
 106
106 -
 107
107 -
 108
108 -
 109
109 -
 110
110 -
 111
111 -
 112
112 -
 113
113 -
 114
114 -
115
-
116
-
117
-
118
-
119
-
120
-
121
-
122
-
123
-
124
-
125
-
126
-
127
-
128
-
129
-
130
-
131
-
132
-
133
-
134
-
135
-
136
-
137
-
138
-
139
-
140
-
141
-
142
-
143
-
144
-
145
-
146
-
147
-
148
-
149
-
150
-
151
-
152
-
153
-
154
-
155
-
156
-
157
-
158
-
159
-
160
-
161
-
162
-
163
-
164
-
165
-
166
-
167
-
168
-
169
-
170
-
171
-
172
-
173
-
174
-
175
-
176
-
177
-
178
-
179
-
180
-
181
-
182
-
183
-
184
-
185
-
186
-
187
-
188
-
189
-
190
-
191
-
192
-
193
-
194
-
195
-
196
-
197
-
198
-
199
-
200
-
201
-
202
-
203
-
204
-
205
-
206
-
207
-
208
-
209
-
210
-
211
-
212
-
213
-
214
-
215
-
216
-
217
-
218
-
219
-
220
-
221
-
222
-
223
-
224
-
225
-
226
-
227
-
228
-
229
-
230
-
231
-
232
-
233
-
234
-
235
-
236
-
237
-
238
-
239
-
240
-
241
-
242
-
243
-
244
-
245
-
246
-
247
-
248
-
249
-
250
-
251
-
252
-
253
-
254
-
255
-
256
-
257
-
258
-
259
-
260
-
261
-
262
-
263
-
264
-
265
-
266
-
267
-
268
-
269
-
270
-
271
-
272
-
273
-
274
-
275
-
276
-
277
-
278
-
279
-
280
-
281
-
282
-
283
-
284
-
285
-
286
-
287
-
288
-
289
-
290
-
291
-
292
-
293
-
294
-
295
-
296
-
297
-
298
-
299
-
300
-
301
-
302
-
303
-
304
-
305
-
306
-
307
-
308
-
309
-
310
-
311
-
312
-
313
-
314
-
315
-
316
-
317
-
318
-
319
-
320
-
321
-
322
-
323
-
324
-
325
-
326
-
327
-
328
-
329
-
330
-
331
-
332
-
333
-
334
-
335
-
336
-
337
-
338
-
339
-
340
-
341
-
342
-
343
-
344
-
345
-
346
-
347
-
348
-
349
-
350
-
351
-
352
-
353
-
354
-
355
-
356
-
357
-
358
-
359
-
360
-
361
-
362
-
363
-
364
-
365
-
366
-
367
-
368
-
369
-
370
-
371
-
372
-
373
-
374
-
375
-
376
-
377
-
378
-
379
-
380
-
381
-
382
-
383
-
384
-
385
-
386
-
387
-
388
-
389
-
390
-
391
-
392
-
393
-
394
-
395
-
396
-
397
-
398
-
399
-
400
-
401
-
402
-
403
-
404
-
405
-
406
-
407
-
408
-
409
-
410
-
411
-
412
-
413
-
414
-
415
-
416
-
417
-
418
-
419
-
420
-
421
-
422
-
423
-
424
-
425
-
426
-
427
-
428
-
429
-
430
-
431
-
432
-
433
-
434
-
435
-
436
-
437
-
438
-
439
-
440
-
441
-
442
-
443
-
444
-
445
-
446
-
447
-
448
-
449
-
450
-
451
-
452
-
453
-
454
-
455
-
456
-
457
-
458
-
459
-
460
-
461
-
462
-
463
-
464
-
465
-
466
-
467
-
468
-
469
-
470
-
471
-
472
-
473
-
474
-
475
-
476
-
477
-
478
-
479
-
480
-
481
-
482
-
483
-
484
-
485
-
486
-
487
-
488
-
489
-
490
-
491
-
492
-
493
-
494
-
495
-
496
-
497
-
498
-
499
-
500
-
501
-
502
-
503
-
504
 |
 |

HSBC HOLDINGS PLC
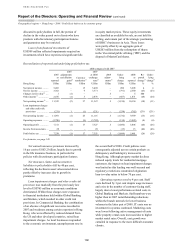
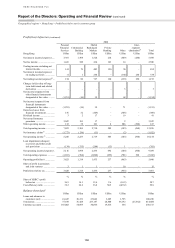
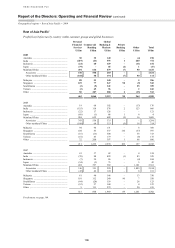
Report of the Directors: Operating and Financial Review (continued)
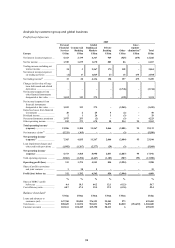
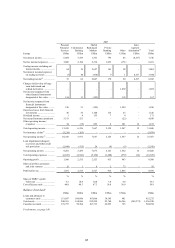
Geographical regions > Hong Kong > 2008 / Profit/(loss) before tax by customer group
102
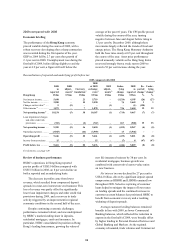
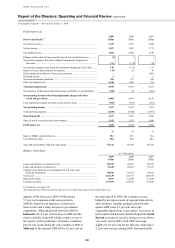
allocated to policyholders in full, the portion of
decline in the value passed on to clients who have
products with discretionary participation features
and guarantees may be restricted.
Losses from financial investments of
US$309 million reflected impairments required on
investments which have experienced significant falls
in equity market prices. These equity investments
are classified as available for sale, are not held for
trading, and remain part of the strategic positioning
of HSBC’s businesses in Asia. These losses
were partly offset by an aggregate gain of
US$203 million from the redemption of shares
in the Visa initial public offering (‘IPO’) and the
disposal of MasterCard shares.
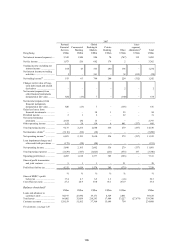
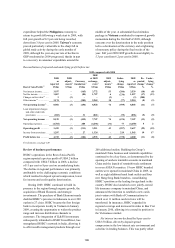
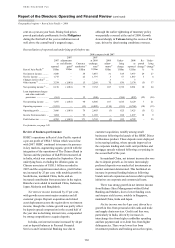
Reconciliation of reported and underlying profit before tax
2008 compared with 2007
Hong Kong
2007
as
reported
US$m
2007
adjustments
and dilution
gains10
US$m
Currency
translation11
US$m
2007
at 2008
exchange
rates17
US$m
2008
adjust-
ments10
US$m
Under-
lying
change
US$m
2008
as
reported
US$m
Re-
ported
change13
%
Under-
lying
change13
%
Net interest income .......... 5,483 – 15 5,498 – 200 5,698 4 4
Net fee income ................. 3,362 – 9 3,371 – (791) 2,580 (23) (23)
Changes in fair value14 .... 1 (1) – – 5 – 5 400
Other income15 ................. 2,476 (1) 3 2,478 – (607) 1,871 (24) (24)
Net operating income16 .... 11,322 (2) 27 11,347 5 (1,198) 10,154 (10) (11)
Loan impairment charges
and other credit risk
provisions .................... (231) 1 (1) (231) – (534) (765) (231) (231)
Net operating income ...... 11,091 (1) 26 11,116 5 (1,732) 9,389 (15) (16)
Operating expenses .......... (3,780) – (9) (3,789) – (154) (3,943) (4) (4)
Operating profit ............... 7,311 (1) 17 7,327 5 (1,886) 5,446 (26) (26)
Income from associates ... 28 – – 28 – (13) 15 (46) (46)
Profit before tax ............... 7,339 (1) 17 7,355 5 (1,899) 5,461 (26) (26)
For footnotes, see page 149.
Net earned insurance premiums increased by
16 per cent to US$3.2 billion, largely due to growth
in the life insurance business, in particular for
policies with discretionary participation features.
Net insurance claims and movement in
liabilities to policyholders fell by 40 per cent,
reflecting the decline in asset values noted above
partly offset by increases due to growth in
premiums.
Loan impairment charges and other credit risk
provisions rose markedly from the previously low
level to US$765 million as economic conditions
deteriorated. Within these charges were exposures
to financial institutions held within Global Banking
and Markets, which resulted in other credit risk
provisions. In Commercial Banking, the combination
of an absence of significant recoveries recorded in
2007 and weakness among certain exporters in Hong
Kong, who were affected by reduced demand from
the US and other developed countries, raised loan
impairment charges. As local businesses responded
to the economic environment, unemployment rose in
the second half of 2008. Credit policies were
consequently adjusted across certain products as
delinquency and bankruptcy increased in
Hong Kong. Although property market declines
reduced equity levels for residential mortgage
customers, the impact on loan impairment charges
was limited as this lending was well-secured and
regulatory restrictions constrained origination
loan-to-value ratios to below 70 per cent.
Operating expenses rose by 4 per cent. Staff
costs declined by 3 per cent despite wage increases
and a rise in the number of customer-facing staff,
largely due to lower performance-related costs in
Global Banking and Markets. Staff numbers were
higher than in 2007 notwithstanding reductions
within the branch network for lower business
volumes in the latter part of 2008. IT costs rose as
investment in systems continued. Marketing costs
were lower following active management of costs
while property rental costs increased due to higher
market rental rates. Overall, cost growth was
curtailed in response to the more difficult economic
climate.