HSBC 2009 Annual Report Download - page 25
Download and view the complete annual report
Please find page 25 of the 2009 HSBC annual report below. You can navigate through the pages in the report by either clicking on the pages listed below, or by using the keyword search tool below to find specific information within the annual report.-
 1
1 -
2
-
3
-
4
-
5
-
6
-
7
-
8
-
9
-
10
-
11
-
12
-
13
-
14
-
 15
15 -
 16
16 -
 17
17 -
 18
18 -
 19
19 -
 20
20 -
 21
21 -
 22
22 -
 23
23 -
 24
24 -
 25
25 -
 26
26 -
 27
27 -
 28
28 -
 29
29 -
 30
30 -
 31
31 -
 32
32 -
 33
33 -
 34
34 -
 35
35 -
36
-
37
-
38
-
39
-
40
-
41
-
42
-
43
-
44
-
45
-
46
-
47
-
48
-
49
-
50
-
51
-
52
-
53
-
54
-
55
-
56
-
57
-
58
-
59
-
60
-
61
-
62
-
63
-
64
-
65
-
66
-
67
-
68
-
69
-
70
-
71
-
72
-
73
-
74
-
75
-
76
-
77
-
78
-
79
-
80
-
81
-
82
-
83
-
84
-
85
-
86
-
87
-
88
-
89
-
90
-
91
-
92
-
93
-
94
-
95
-
96
-
97
-
98
-
99
-
100
-
101
-
102
-
103
-
104
-
105
-
106
-
107
-
108
-
109
-
110
-
111
-
112
-
113
-
114
-
115
-
116
-
117
-
118
-
119
-
120
-
121
-
122
-
123
-
124
-
125
-
126
-
127
-
128
-
129
-
130
-
131
-
132
-
133
-
134
-
135
-
136
-
137
-
138
-
139
-
140
-
141
-
142
-
143
-
144
-
145
-
146
-
147
-
148
-
149
-
150
-
151
-
152
-
153
-
154
-
155
-
156
-
157
-
158
-
159
-
160
-
161
-
162
-
163
-
164
-
165
-
166
-
167
-
168
-
169
-
170
-
171
-
172
-
173
-
174
-
175
-
176
-
177
-
178
-
179
-
180
-
181
-
182
-
183
-
184
-
185
-
186
-
187
-
188
-
189
-
190
-
191
-
192
-
193
-
194
-
195
-
196
-
197
-
198
-
199
-
200
-
201
-
202
-
203
-
204
-
205
-
206
-
207
-
208
-
209
-
210
-
211
-
212
-
213
-
214
-
215
-
216
-
217
-
218
-
219
-
220
-
221
-
222
-
223
-
224
-
225
-
226
-
227
-
228
-
229
-
230
-
231
-
232
-
233
-
234
-
235
-
236
-
237
-
238
-
239
-
240
-
241
-
242
-
243
-
244
-
245
-
246
-
247
-
248
-
249
-
250
-
251
-
252
-
253
-
254
-
255
-
256
-
257
-
258
-
259
-
260
-
261
-
262
-
263
-
264
-
265
-
266
-
267
-
268
-
269
-
270
-
271
-
272
-
273
-
274
-
275
-
276
-
277
-
278
-
279
-
280
-
281
-
282
-
283
-
284
-
285
-
286
-
287
-
288
-
289
-
290
-
291
-
292
-
293
-
294
-
295
-
296
-
297
-
298
-
299
-
300
-
301
-
302
-
303
-
304
-
305
-
306
-
307
-
308
-
309
-
310
-
311
-
312
-
313
-
314
-
315
-
316
-
317
-
318
-
319
-
320
-
321
-
322
-
323
-
324
-
325
-
326
-
327
-
328
-
329
-
330
-
331
-
332
-
333
-
334
-
335
-
336
-
337
-
338
-
339
-
340
-
341
-
342
-
343
-
344
-
345
-
346
-
347
-
348
-
349
-
350
-
351
-
352
-
353
-
354
-
355
-
356
-
357
-
358
-
359
-
360
-
361
-
362
-
363
-
364
-
365
-
366
-
367
-
368
-
369
-
370
-
371
-
372
-
373
-
374
-
375
-
376
-
377
-
378
-
379
-
380
-
381
-
382
-
383
-
384
-
385
-
386
-
387
-
388
-
389
-
390
-
391
-
392
-
393
-
394
-
395
-
396
-
397
-
398
-
399
-
400
-
401
-
402
-
403
-
404
-
405
-
406
-
407
-
408
-
409
-
410
-
411
-
412
-
413
-
414
-
415
-
416
-
417
-
418
-
419
-
420
-
421
-
422
-
423
-
424
-
425
-
426
-
427
-
428
-
429
-
430
-
431
-
432
-
433
-
434
-
435
-
436
-
437
-
438
-
439
-
440
-
441
-
442
-
443
-
444
-
445
-
446
-
447
-
448
-
449
-
450
-
451
-
452
-
453
-
454
-
455
-
456
-
457
-
458
-
459
-
460
-
461
-
462
-
463
-
464
-
465
-
466
-
467
-
468
-
469
-
470
-
471
-
472
-
473
-
474
-
475
-
476
-
477
-
478
-
479
-
480
-
481
-
482
-
483
-
484
-
485
-
486
-
487
-
488
-
489
-
490
-
491
-
492
-
493
-
494
-
495
-
496
-
497
-
498
-
499
-
500
-
501
-
502
-
503
-
504
 |
 |

23
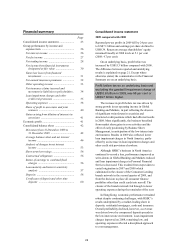
Financial summary
Page
Consolidated income statement ..................... 23
Group performance by income and
expense item .............................................. 26
Net interest income .................................... 26
Net fee income ........................................... 27
Net trading income .................................... 28
Net income from financial instruments
designated at fair value .......................... 30
Gains less losses from financial
investments ............................................. 31
Net earned insurance premiums ................ 32
Other operating income ............................. 33
Net insurance claims incurred and
movement in liabilities to policyholders .34
Loan impairment charges and other
credit risk provisions .............................. 35
Operating expenses .................................... 38
Share of profit in associates and joint
ventures .................................................. 40
Gains arising from dilution of interests in
associates ............................................... 41
Economic profit ............................................. 41
Consolidated balance sheet ........................... 42
Movement from 31 December 2008 to
31 December 2009 ................................. 42
Average balance sheet and net interest
income .................................................... 46
Analysis of changes in net interest
income .................................................... 53
Short-term borrowings ............................... 56
Contractual obligations ............................. 56
Ratios of earnings to combined fixed
charges ................................................... 56
Loan maturity and interest sensitivity
analysis .................................................. 57
Deposits ..................................................... 58
Certificates of deposit and other time
deposits .................................................. 60
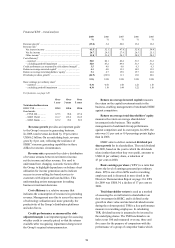
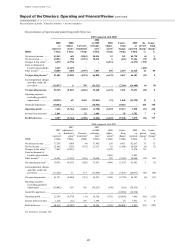
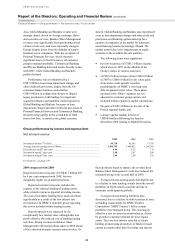
Consolidated income statement
2009 compared with 2008
Reported pre-tax profits in 2009 fell by 24 per cent
to US$7.1 billion and earnings per share declined to
US$0.34. Return on average shareholders’ equity
remained broadly at 2008 levels at 5.1 per cent
(2008: 4.7 per cent).
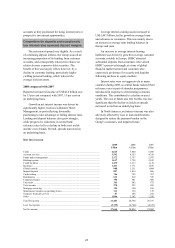
On an underlying basis, profit before tax
increased by US$15.3 billion compared with 2008.
The difference between reported and underlying
results is explained on page 21. Except where
otherwise stated, the commentaries in the Financial
Summary are on an underlying basis.
Profit before tax on an underlying basis and
excluding the goodwill impairment charge of
US$10.6 billion in 2008, was 56 per cent or
US$4.7 billion higher.
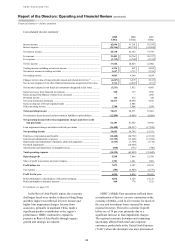
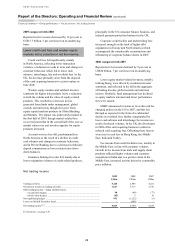
The increase in profit before tax was driven by
strong growth in net operating income in Global
Banking and Markets, in part reflecting the absence
of significant write-downs in securities and
structured credit positions which had affected results
in 2008. More significantly, the business benefited
from market share gains in core activities and the
effect of early positioning by Balance Sheet
Management, in anticipation of the low interest rate
environment. Results in 2009 also reflected lower
loan impairment charges in North America, partly
offset by an increase in loan impairment charges and
other credit risk provisions elsewhere.
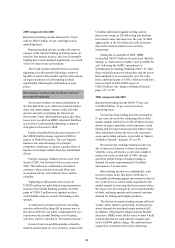
Although HSBC’s business in North America
continued to record a loss, performance improved as
write-downs in Global Banking and Markets reduced
and loan impairment charges in Personal Financial
Services decreased. This resulted from steps taken to
curtail origination in 2007 and 2008 which
culminated in the closure of the Consumer Lending
branch network in the second quarter of 2009, and
from the decision to place all consumer finance
portfolios other than credit cards into run-off. The
closure of the branch network fed through to lower
operating expenses during the remainder of the year.
In Hong Kong, economic performance remained
robust despite continuing challenges, with HSBC’s
results underpinned by a market-leading share in
deposits, residential mortgages, cards and insurance.
Overall profitability declined, however, as revenue
was driven lower by compressed deposit spreads in
the low interest rate environment. Loan impairment
charges improved on 2008, remaining low, and
operating expenses reflected a disciplined approach
to cost management.