HSBC 2009 Annual Report Download - page 28
Download and view the complete annual report
Please find page 28 of the 2009 HSBC annual report below. You can navigate through the pages in the report by either clicking on the pages listed below, or by using the keyword search tool below to find specific information within the annual report.-
 1
1 -
2
-
3
-
4
-
5
-
6
-
7
-
8
-
9
-
10
-
11
-
12
-
13
-
14
-
15
-
16
-
17
-
 18
18 -
 19
19 -
 20
20 -
 21
21 -
 22
22 -
 23
23 -
 24
24 -
 25
25 -
 26
26 -
 27
27 -
 28
28 -
 29
29 -
 30
30 -
 31
31 -
 32
32 -
 33
33 -
 34
34 -
 35
35 -
 36
36 -
 37
37 -
 38
38 -
39
-
40
-
41
-
42
-
43
-
44
-
45
-
46
-
47
-
48
-
49
-
50
-
51
-
52
-
53
-
54
-
55
-
56
-
57
-
58
-
59
-
60
-
61
-
62
-
63
-
64
-
65
-
66
-
67
-
68
-
69
-
70
-
71
-
72
-
73
-
74
-
75
-
76
-
77
-
78
-
79
-
80
-
81
-
82
-
83
-
84
-
85
-
86
-
87
-
88
-
89
-
90
-
91
-
92
-
93
-
94
-
95
-
96
-
97
-
98
-
99
-
100
-
101
-
102
-
103
-
104
-
105
-
106
-
107
-
108
-
109
-
110
-
111
-
112
-
113
-
114
-
115
-
116
-
117
-
118
-
119
-
120
-
121
-
122
-
123
-
124
-
125
-
126
-
127
-
128
-
129
-
130
-
131
-
132
-
133
-
134
-
135
-
136
-
137
-
138
-
139
-
140
-
141
-
142
-
143
-
144
-
145
-
146
-
147
-
148
-
149
-
150
-
151
-
152
-
153
-
154
-
155
-
156
-
157
-
158
-
159
-
160
-
161
-
162
-
163
-
164
-
165
-
166
-
167
-
168
-
169
-
170
-
171
-
172
-
173
-
174
-
175
-
176
-
177
-
178
-
179
-
180
-
181
-
182
-
183
-
184
-
185
-
186
-
187
-
188
-
189
-
190
-
191
-
192
-
193
-
194
-
195
-
196
-
197
-
198
-
199
-
200
-
201
-
202
-
203
-
204
-
205
-
206
-
207
-
208
-
209
-
210
-
211
-
212
-
213
-
214
-
215
-
216
-
217
-
218
-
219
-
220
-
221
-
222
-
223
-
224
-
225
-
226
-
227
-
228
-
229
-
230
-
231
-
232
-
233
-
234
-
235
-
236
-
237
-
238
-
239
-
240
-
241
-
242
-
243
-
244
-
245
-
246
-
247
-
248
-
249
-
250
-
251
-
252
-
253
-
254
-
255
-
256
-
257
-
258
-
259
-
260
-
261
-
262
-
263
-
264
-
265
-
266
-
267
-
268
-
269
-
270
-
271
-
272
-
273
-
274
-
275
-
276
-
277
-
278
-
279
-
280
-
281
-
282
-
283
-
284
-
285
-
286
-
287
-
288
-
289
-
290
-
291
-
292
-
293
-
294
-
295
-
296
-
297
-
298
-
299
-
300
-
301
-
302
-
303
-
304
-
305
-
306
-
307
-
308
-
309
-
310
-
311
-
312
-
313
-
314
-
315
-
316
-
317
-
318
-
319
-
320
-
321
-
322
-
323
-
324
-
325
-
326
-
327
-
328
-
329
-
330
-
331
-
332
-
333
-
334
-
335
-
336
-
337
-
338
-
339
-
340
-
341
-
342
-
343
-
344
-
345
-
346
-
347
-
348
-
349
-
350
-
351
-
352
-
353
-
354
-
355
-
356
-
357
-
358
-
359
-
360
-
361
-
362
-
363
-
364
-
365
-
366
-
367
-
368
-
369
-
370
-
371
-
372
-
373
-
374
-
375
-
376
-
377
-
378
-
379
-
380
-
381
-
382
-
383
-
384
-
385
-
386
-
387
-
388
-
389
-
390
-
391
-
392
-
393
-
394
-
395
-
396
-
397
-
398
-
399
-
400
-
401
-
402
-
403
-
404
-
405
-
406
-
407
-
408
-
409
-
410
-
411
-
412
-
413
-
414
-
415
-
416
-
417
-
418
-
419
-
420
-
421
-
422
-
423
-
424
-
425
-
426
-
427
-
428
-
429
-
430
-
431
-
432
-
433
-
434
-
435
-
436
-
437
-
438
-
439
-
440
-
441
-
442
-
443
-
444
-
445
-
446
-
447
-
448
-
449
-
450
-
451
-
452
-
453
-
454
-
455
-
456
-
457
-
458
-
459
-
460
-
461
-
462
-
463
-
464
-
465
-
466
-
467
-
468
-
469
-
470
-
471
-
472
-
473
-
474
-
475
-
476
-
477
-
478
-
479
-
480
-
481
-
482
-
483
-
484
-
485
-
486
-
487
-
488
-
489
-
490
-
491
-
492
-
493
-
494
-
495
-
496
-
497
-
498
-
499
-
500
-
501
-
502
-
503
-
504
 |
 |

HSBC HOLDINGS PLC
Report of the Directors: Operating and Financial Review (continued)
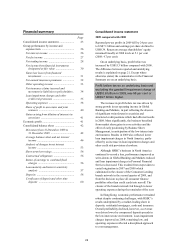
Financial summary > Group performance > Net interest income / Net fee income
26
Asia, Global Banking and Markets’ results were
strongly ahead, driven by foreign exchange, Rates
and securities services. Balance Sheet Management
revenues rose significantly from positioning ahead
of interest rate cuts, and were especially strong in
Europe despite losses from the defaults of certain
financial sector companies. With the exception of
Personal Financial Services, which incurred
significant losses in North America, all customer
groups remained profitable. Commercial Banking
and Private Banking delivered results broadly in line
with 2007, while Global Banking and Markets’
profits declined.
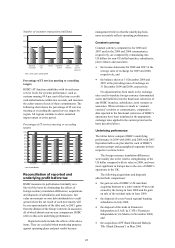
Performance was overshadowed by a
US$7.8 billion rise in loan impairment charges and
other credit risk provisions, largely from the US
consumer finance business, and a further
US$5.4 billion in trading write-downs on illiquid
legacy positions in credit trading, leveraged and
acquisition finance and monoline credit exposure in
Global Banking and Markets. Increases in loan
impairment charges and other credit risk provisions in
Personal Financial Services and Commercial Banking,
the latter rising rapidly in the second half of 2008
from a low base, occurred as the global economy
slowed. Global Banking and Markets also experienced
a rise in loan impairment charges and other credit risk
provisions as refinancing options dried up for a
number of companies as the market for long-term
asset financing became increasingly illiquid. The
market turmoil also led to impairments on equity
securities in the available-for-sale portfolio.
The following items were significant:
• the non-recurrence of US$1.1 billion of gains
which arose in 2007 on the dilution of the
Group’s stakes in various associates;
• a US$3.6 billion increase (from US$3.0 billion
in 2007 to US$6.6 billion) in fair value gains
from wider credit spreads recorded
predominantly on HSBC’s own long-term
debt designated at fair value. These gains
reported in the ‘Other’ segment, are not
allocated to customer groups and are not
included within regulatory capital calculations;
• the gain of US$2.4 billion on the sale of the
French regional banks; and
• a charge against trading income of
US$984 million following the fraud in
December 2008 relating to Madoff Securities.
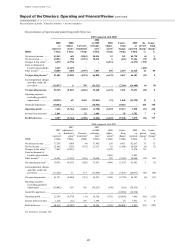
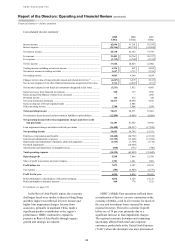
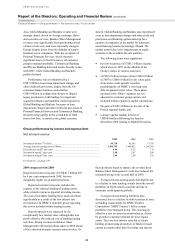
Group performance by income and expense item
Net interest income
2009 2008 2007
Net interest income19 (US$m) ................................................................................. 40,730 42,563 37,795
Average interest-earning assets (US$m) ................................................................. 1,384,705 1,466,622 1,296,701
Gross interest yield20 (per cent) ............................................................................... 4.48 6.23 7.12
Net interest spread21 (per cent) ................................................................................ 2.90 2.87 2.86
Net interest margin22 (per cent) ............................................................................... 2.94 2.90 2.91
For footnotes, see page 149.
2009 compared with 2008
Reported net interest income of US$40.7 billion fell
by 4 per cent compared with 2008, but was
marginally higher on an underlying basis.
Reported net interest income includes the
expense of the internal funding of trading assets,
while related revenue is reported in trading income.
The cost of internally funding these assets declined
significantly as a result of the low interest rate
environment. In HSBC’s customer group reporting,
this cost is included within trading income.
Deposit spreads were squeezed by the
exceptionally low interest rates, although this was
partly offset by the reduced cost of funding trading
activities. Strong revenues in Balance Sheet
Management reflected positions taken in 2008 ahead
of the reduction in major currency interest rates. As
these positions began to mature, the revenue from
Balance Sheet Management’s activities reduced but
remained strong in the second half of 2009.
Average interest-earning assets fell slightly due
to a decline in term lending, mainly from the run-off
portfolios in North America and the decline in
consumer credit appetite globally.
Average interest-bearing liabilities also
decreased, due to a decline in debt securities in issue
as funding requirements for HSBC Finance
Corporation (‘HSBC Finance’) fell as certain
portfolios were managed down. This was largely
offset by a rise in current account balances, driven
by growth in customer demand for more liquid
assets. The very low interest rates led to clients
holding an increasing proportion of funds in liquid
current accounts rather than in savings and deposit