HSBC 2009 Annual Report Download - page 21
Download and view the complete annual report
Please find page 21 of the 2009 HSBC annual report below. You can navigate through the pages in the report by either clicking on the pages listed below, or by using the keyword search tool below to find specific information within the annual report.-
 1
1 -
2
-
3
-
4
-
5
-
6
-
7
-
8
-
9
-
10
-
 11
11 -
 12
12 -
 13
13 -
 14
14 -
 15
15 -
 16
16 -
 17
17 -
 18
18 -
 19
19 -
 20
20 -
 21
21 -
 22
22 -
 23
23 -
 24
24 -
 25
25 -
 26
26 -
 27
27 -
 28
28 -
 29
29 -
 30
30 -
 31
31 -
32
-
33
-
34
-
35
-
36
-
37
-
38
-
39
-
40
-
41
-
42
-
43
-
44
-
45
-
46
-
47
-
48
-
49
-
50
-
51
-
52
-
53
-
54
-
55
-
56
-
57
-
58
-
59
-
60
-
61
-
62
-
63
-
64
-
65
-
66
-
67
-
68
-
69
-
70
-
71
-
72
-
73
-
74
-
75
-
76
-
77
-
78
-
79
-
80
-
81
-
82
-
83
-
84
-
85
-
86
-
87
-
88
-
89
-
90
-
91
-
92
-
93
-
94
-
95
-
96
-
97
-
98
-
99
-
100
-
101
-
102
-
103
-
104
-
105
-
106
-
107
-
108
-
109
-
110
-
111
-
112
-
113
-
114
-
115
-
116
-
117
-
118
-
119
-
120
-
121
-
122
-
123
-
124
-
125
-
126
-
127
-
128
-
129
-
130
-
131
-
132
-
133
-
134
-
135
-
136
-
137
-
138
-
139
-
140
-
141
-
142
-
143
-
144
-
145
-
146
-
147
-
148
-
149
-
150
-
151
-
152
-
153
-
154
-
155
-
156
-
157
-
158
-
159
-
160
-
161
-
162
-
163
-
164
-
165
-
166
-
167
-
168
-
169
-
170
-
171
-
172
-
173
-
174
-
175
-
176
-
177
-
178
-
179
-
180
-
181
-
182
-
183
-
184
-
185
-
186
-
187
-
188
-
189
-
190
-
191
-
192
-
193
-
194
-
195
-
196
-
197
-
198
-
199
-
200
-
201
-
202
-
203
-
204
-
205
-
206
-
207
-
208
-
209
-
210
-
211
-
212
-
213
-
214
-
215
-
216
-
217
-
218
-
219
-
220
-
221
-
222
-
223
-
224
-
225
-
226
-
227
-
228
-
229
-
230
-
231
-
232
-
233
-
234
-
235
-
236
-
237
-
238
-
239
-
240
-
241
-
242
-
243
-
244
-
245
-
246
-
247
-
248
-
249
-
250
-
251
-
252
-
253
-
254
-
255
-
256
-
257
-
258
-
259
-
260
-
261
-
262
-
263
-
264
-
265
-
266
-
267
-
268
-
269
-
270
-
271
-
272
-
273
-
274
-
275
-
276
-
277
-
278
-
279
-
280
-
281
-
282
-
283
-
284
-
285
-
286
-
287
-
288
-
289
-
290
-
291
-
292
-
293
-
294
-
295
-
296
-
297
-
298
-
299
-
300
-
301
-
302
-
303
-
304
-
305
-
306
-
307
-
308
-
309
-
310
-
311
-
312
-
313
-
314
-
315
-
316
-
317
-
318
-
319
-
320
-
321
-
322
-
323
-
324
-
325
-
326
-
327
-
328
-
329
-
330
-
331
-
332
-
333
-
334
-
335
-
336
-
337
-
338
-
339
-
340
-
341
-
342
-
343
-
344
-
345
-
346
-
347
-
348
-
349
-
350
-
351
-
352
-
353
-
354
-
355
-
356
-
357
-
358
-
359
-
360
-
361
-
362
-
363
-
364
-
365
-
366
-
367
-
368
-
369
-
370
-
371
-
372
-
373
-
374
-
375
-
376
-
377
-
378
-
379
-
380
-
381
-
382
-
383
-
384
-
385
-
386
-
387
-
388
-
389
-
390
-
391
-
392
-
393
-
394
-
395
-
396
-
397
-
398
-
399
-
400
-
401
-
402
-
403
-
404
-
405
-
406
-
407
-
408
-
409
-
410
-
411
-
412
-
413
-
414
-
415
-
416
-
417
-
418
-
419
-
420
-
421
-
422
-
423
-
424
-
425
-
426
-
427
-
428
-
429
-
430
-
431
-
432
-
433
-
434
-
435
-
436
-
437
-
438
-
439
-
440
-
441
-
442
-
443
-
444
-
445
-
446
-
447
-
448
-
449
-
450
-
451
-
452
-
453
-
454
-
455
-
456
-
457
-
458
-
459
-
460
-
461
-
462
-
463
-
464
-
465
-
466
-
467
-
468
-
469
-
470
-
471
-
472
-
473
-
474
-
475
-
476
-
477
-
478
-
479
-
480
-
481
-
482
-
483
-
484
-
485
-
486
-
487
-
488
-
489
-
490
-
491
-
492
-
493
-
494
-
495
-
496
-
497
-
498
-
499
-
500
-
501
-
502
-
503
-
504
 |
 |

19
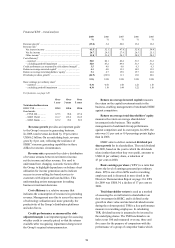
Financial KPIs – trend analysis
2009 2008 2007 2006 2005
% % % % %
Revenue growth1 .................................................................... (19.0) 3.4 20.8 13.4 12.2
Revenue mix2
Net interest income ........................................................... 61.5 52.1 47.8 52.8 54.4
Net fee income .................................................................. 26.7 24.5 27.9 26.3 25.1
Other income3 .................................................................... 11.8 23.4 24.3 20.9 20.5
Cost efficiency4
– reported ........................................................................... 52.0 60.1 49.4 51.3 51.2
– excluding goodwill impairment ..................................... 52.0 47.2 49.4 51.3 51.2
Credit performance as measured by risk adjusted margin5 ... 3.5 4.8 6.0 6.3 6.3
Return on average invested capital6 ...................................... 4.1 4.0 15.3 14.9 15.9
Return on average total shareholders’ equity7........................ 5.1 4.7 15.9 15.7 16.8
Dividends per share growth8.................................................. (46.9) (28.9) 11.1 11.0 10.6
US$ US$ US$ US$ US$
Basic earnings per ordinary share9
– reported ........................................................................... 0.34 0.41 1.44 1.22 1.18
– excluding goodwill impairment ..................................... 0.34 1.19 1.44 1.22 1.18
For footnotes, see page 149.
Over Over Over
1 year 3 years 5 years
Total shareholder return
HSBC TSR .................. 128.3 103.6 120.6
Benchmarks:
– FTSE 100 ............. 127.3 98.0 135.4
– MSCI World ........ 116.7 103.6 134.9
– MSCI Banks ........ 125.2 70.6 92.3
Revenue growth provides an important guide
to the Group’s success in generating business.
In 2009, total revenue declined by 19 per cent to
US$66.2 billion. On an underlying basis, revenue
grew by 8 per cent, reflecting the resilience of
HSBC’s income generating capabilities in these
difficult economic circumstances.
Revenue mix represents the relative distribution
of revenue streams between net interest income,
net fee income and other revenue. It is used to
understand how changing economic factors affect
the Group, to highlight dependence on balance sheet
utilisation for income generation and to indicate
success in cross-selling fee-based services to
customers with deposit and loan facilities. This
understanding assists management in making
business investment decisions.
Cost efficiency is a relative measure that
indicates the consumption of resources in generating
revenue. Management uses this to assess the success
of technology utilisation and, more generally, the
productivity of the Group’s distribution platforms
and sales forces.
Credit performance as measured by risk-
adjusted margin is an important gauge for assessing
whether credit is correctly priced so that the returns
available after recognising impairment charges meet
the Group’s required return parameters.
Return on average invested capital measures
the return on the capital investment made in the
business, enabling management to benchmark HSBC
against competitors.
Return on average total shareholders’ equity
measures the return on average shareholders’
investment in the business. This enables
management to benchmark Group performance
against competitors and its own targets. In 2009, the
ratio was 5.1 per cent or 0.4 percentage points higher
than in 2008.
HSBC aims to deliver sustained dividend per
share growth for its shareholders. The total dividend
for 2009, based on the year to which the dividends
relate (rather than when they were paid), amounts to
US$0.34 per ordinary share, a reduction of
47 per cent on 2008.
Basic earnings per share (‘EPS’) is a ratio that
shows the level of earnings generated per ordinary
share. EPS is one of two KPIs used in rewarding
employees and is discussed in more detail in the
Directors’ Remuneration Report on page 334. EPS
for 2009 was US$0.34, a decline of 17 per cent on
2008.
Total shareholder return is used as a method
of assessing the overall return to shareholders on
their investment in HSBC, and is defined as the
growth in share value and declared dividend income
during the relevant period. TSR is a key performance
measure in rewarding employees. In calculating
TSR, dividend income is assumed to be invested in
the underlying shares. The TSR benchmark is an
index set at 100 and measured over one, three and
five years for the purpose of comparison with the
performance of a group of competitor banks which