HSBC 2009 Annual Report Download - page 110
Download and view the complete annual report
Please find page 110 of the 2009 HSBC annual report below. You can navigate through the pages in the report by either clicking on the pages listed below, or by using the keyword search tool below to find specific information within the annual report.-
 1
1 -
2
-
3
-
4
-
5
-
6
-
7
-
8
-
9
-
10
-
11
-
12
-
13
-
14
-
15
-
16
-
17
-
18
-
19
-
20
-
21
-
22
-
23
-
24
-
25
-
26
-
27
-
28
-
29
-
30
-
31
-
32
-
33
-
34
-
35
-
36
-
37
-
38
-
39
-
40
-
41
-
42
-
43
-
44
-
45
-
46
-
47
-
48
-
49
-
50
-
51
-
52
-
53
-
54
-
55
-
56
-
57
-
58
-
59
-
60
-
61
-
62
-
63
-
64
-
65
-
66
-
67
-
68
-
69
-
70
-
71
-
72
-
73
-
74
-
75
-
76
-
77
-
78
-
79
-
80
-
81
-
82
-
83
-
84
-
85
-
86
-
87
-
88
-
89
-
90
-
91
-
92
-
93
-
94
-
95
-
96
-
97
-
98
-
99
-
 100
100 -
 101
101 -
 102
102 -
 103
103 -
 104
104 -
 105
105 -
 106
106 -
 107
107 -
 108
108 -
 109
109 -
 110
110 -
 111
111 -
 112
112 -
 113
113 -
 114
114 -
 115
115 -
 116
116 -
 117
117 -
 118
118 -
 119
119 -
 120
120 -
121
-
122
-
123
-
124
-
125
-
126
-
127
-
128
-
129
-
130
-
131
-
132
-
133
-
134
-
135
-
136
-
137
-
138
-
139
-
140
-
141
-
142
-
143
-
144
-
145
-
146
-
147
-
148
-
149
-
150
-
151
-
152
-
153
-
154
-
155
-
156
-
157
-
158
-
159
-
160
-
161
-
162
-
163
-
164
-
165
-
166
-
167
-
168
-
169
-
170
-
171
-
172
-
173
-
174
-
175
-
176
-
177
-
178
-
179
-
180
-
181
-
182
-
183
-
184
-
185
-
186
-
187
-
188
-
189
-
190
-
191
-
192
-
193
-
194
-
195
-
196
-
197
-
198
-
199
-
200
-
201
-
202
-
203
-
204
-
205
-
206
-
207
-
208
-
209
-
210
-
211
-
212
-
213
-
214
-
215
-
216
-
217
-
218
-
219
-
220
-
221
-
222
-
223
-
224
-
225
-
226
-
227
-
228
-
229
-
230
-
231
-
232
-
233
-
234
-
235
-
236
-
237
-
238
-
239
-
240
-
241
-
242
-
243
-
244
-
245
-
246
-
247
-
248
-
249
-
250
-
251
-
252
-
253
-
254
-
255
-
256
-
257
-
258
-
259
-
260
-
261
-
262
-
263
-
264
-
265
-
266
-
267
-
268
-
269
-
270
-
271
-
272
-
273
-
274
-
275
-
276
-
277
-
278
-
279
-
280
-
281
-
282
-
283
-
284
-
285
-
286
-
287
-
288
-
289
-
290
-
291
-
292
-
293
-
294
-
295
-
296
-
297
-
298
-
299
-
300
-
301
-
302
-
303
-
304
-
305
-
306
-
307
-
308
-
309
-
310
-
311
-
312
-
313
-
314
-
315
-
316
-
317
-
318
-
319
-
320
-
321
-
322
-
323
-
324
-
325
-
326
-
327
-
328
-
329
-
330
-
331
-
332
-
333
-
334
-
335
-
336
-
337
-
338
-
339
-
340
-
341
-
342
-
343
-
344
-
345
-
346
-
347
-
348
-
349
-
350
-
351
-
352
-
353
-
354
-
355
-
356
-
357
-
358
-
359
-
360
-
361
-
362
-
363
-
364
-
365
-
366
-
367
-
368
-
369
-
370
-
371
-
372
-
373
-
374
-
375
-
376
-
377
-
378
-
379
-
380
-
381
-
382
-
383
-
384
-
385
-
386
-
387
-
388
-
389
-
390
-
391
-
392
-
393
-
394
-
395
-
396
-
397
-
398
-
399
-
400
-
401
-
402
-
403
-
404
-
405
-
406
-
407
-
408
-
409
-
410
-
411
-
412
-
413
-
414
-
415
-
416
-
417
-
418
-
419
-
420
-
421
-
422
-
423
-
424
-
425
-
426
-
427
-
428
-
429
-
430
-
431
-
432
-
433
-
434
-
435
-
436
-
437
-
438
-
439
-
440
-
441
-
442
-
443
-
444
-
445
-
446
-
447
-
448
-
449
-
450
-
451
-
452
-
453
-
454
-
455
-
456
-
457
-
458
-
459
-
460
-
461
-
462
-
463
-
464
-
465
-
466
-
467
-
468
-
469
-
470
-
471
-
472
-
473
-
474
-
475
-
476
-
477
-
478
-
479
-
480
-
481
-
482
-
483
-
484
-
485
-
486
-
487
-
488
-
489
-
490
-
491
-
492
-
493
-
494
-
495
-
496
-
497
-
498
-
499
-
500
-
501
-
502
-
503
-
504
 |
 |

HSBC HOLDINGS PLC
Report of the Directors: Operating and Financial Review (continued)
Geographical regions > Rest of Asia-Pacific > 2009
108
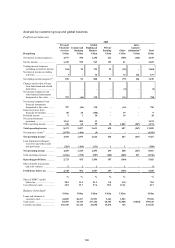
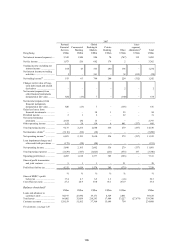
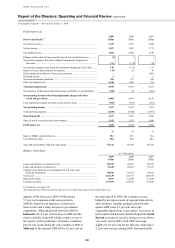
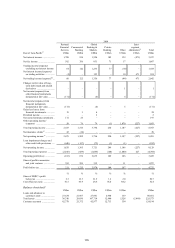
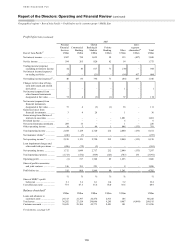
Profit before tax
2009 2008 2007
Rest of Asia-Pacific27 US$m US$m US$m
Net interest income ............................................................................................. 3,539 3,937 3,049
Net fee income .................................................................................................... 1,557 1,867 1,775
Net trading income ............................................................................................. 1,606 2,042 1,346
Changes in fair value of long-term debt issued and related derivatives ............ (1) 1 1
Net income/(expense) from other financial instruments designated at
fair value ........................................................................................................ 111 (172) 110
Net income/(expense) from financial instruments designated at fair value ...... 110 (171) 111
Gains less losses from financial investments ..................................................... (19) 24 36
Gains arising from dilution of interests in associates ........................................ – – 1,081
Dividend income ................................................................................................. 2 2 6
Net earned insurance premiums ......................................................................... 365 197 226
Other operating income ...................................................................................... 1,238 1,055 781
Total operating income .................................................................................... 8,398 8,953 8,411
Net insurance claims incurred and movement in liabilities to policyholders .... (395) 28 (253)
Net operating income before loan impairment charges and other
credit risk provisions ................................................................................... 8,003 8,981 8,158
Loan impairment charges and other credit risk provisions ................................ (896) (852) (561)
Net operating income ....................................................................................... 7,107 8,129 7,597
Total operating expenses .................................................................................... (4,450) (4,704) (3,991)
Operating profit ................................................................................................ 2,657 3,425 3,606
Share of profit in associates and joint ventures .................................................. 1,543 1,297 1,096
Profit before tax ................................................................................................ 4,200 4,722 4,702
% % %
Share of HSBC’s profit before tax ..................................................................... 59.3 50.7 19.4
Cost efficiency ratio ........................................................................................... 55.6 52.4 48.9
Year-end staff numbers (full-time equivalent) ................................................... 87,141 89,706 80,523
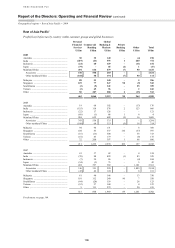
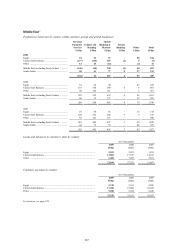
Balance sheet data41
At 31 December
2009
US$m
2008
US$m
2007
US$m
Loans and advances to customers (net) .............................................................. 80,043 80,661 80,245
Loans and advances to banks (net) ..................................................................... 35,648 28,665 32,373
Trading assets, financial assets designated at fair value, and
financial investments ...................................................................................... 58,941 53,167 54,541
Total assets ......................................................................................................... 222,139 225,573 208,195
Deposits by banks ............................................................................................... 8,075 12,688 15,100
Customer accounts .............................................................................................. 133,999 124,194 119,296
For footnotes, see page 149.
All commentaries on Rest of Asia-Pacific are on an underlying basis unless stated otherwise.
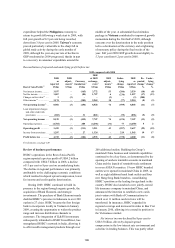
quarters of the fiscal year 2009/10 following a
5.7 per cent expansion in the same period in
2008/09, helped by an aggressive reduction in
interest rates and a sharp increase in government
expenditure. Although growth slowed in 2009 in
Indonesia, the 4.5 per cent increase in GDP and the
relative stability of growth left the country as one of
the region’s better performers. Economic conditions
proved very weak during the early months of 2009 in
Malaysia as first quarter GDP fell by 6.2 per cent on
the same period in 2008, but a strong recovery,
helped by an improvement in regional trade activity
and a domestic stimulus package, placed fourth
quarter GDP some 4.5 per cent above the
comparable figure from a year earlier. A recovery in
both exports and domestic demand helped the South
Korean economy to record a strong recovery from a
very weak start to 2009, with GDP increasing
slightly by 0.2 per cent for the full year, following a
2.2 per cent increase during 2008. Increased public