HSBC 2009 Annual Report Download - page 211
Download and view the complete annual report
Please find page 211 of the 2009 HSBC annual report below. You can navigate through the pages in the report by either clicking on the pages listed below, or by using the keyword search tool below to find specific information within the annual report.-
 1
1 -
2
-
3
-
4
-
5
-
6
-
7
-
8
-
9
-
10
-
11
-
12
-
13
-
14
-
15
-
16
-
17
-
18
-
19
-
20
-
21
-
22
-
23
-
24
-
25
-
26
-
27
-
28
-
29
-
30
-
31
-
32
-
33
-
34
-
35
-
36
-
37
-
38
-
39
-
40
-
41
-
42
-
43
-
44
-
45
-
46
-
47
-
48
-
49
-
50
-
51
-
52
-
53
-
54
-
55
-
56
-
57
-
58
-
59
-
60
-
61
-
62
-
63
-
64
-
65
-
66
-
67
-
68
-
69
-
70
-
71
-
72
-
73
-
74
-
75
-
76
-
77
-
78
-
79
-
80
-
81
-
82
-
83
-
84
-
85
-
86
-
87
-
88
-
89
-
90
-
91
-
92
-
93
-
94
-
95
-
96
-
97
-
98
-
99
-
100
-
101
-
102
-
103
-
104
-
105
-
106
-
107
-
108
-
109
-
110
-
111
-
112
-
113
-
114
-
115
-
116
-
117
-
118
-
119
-
120
-
121
-
122
-
123
-
124
-
125
-
126
-
127
-
128
-
129
-
130
-
131
-
132
-
133
-
134
-
135
-
136
-
137
-
138
-
139
-
140
-
141
-
142
-
143
-
144
-
145
-
146
-
147
-
148
-
149
-
150
-
151
-
152
-
153
-
154
-
155
-
156
-
157
-
158
-
159
-
160
-
161
-
162
-
163
-
164
-
165
-
166
-
167
-
168
-
169
-
170
-
171
-
172
-
173
-
174
-
175
-
176
-
177
-
178
-
179
-
180
-
181
-
182
-
183
-
184
-
185
-
186
-
187
-
188
-
189
-
190
-
191
-
192
-
193
-
194
-
195
-
196
-
197
-
198
-
199
-
200
-
 201
201 -
 202
202 -
 203
203 -
 204
204 -
 205
205 -
 206
206 -
 207
207 -
 208
208 -
 209
209 -
 210
210 -
 211
211 -
 212
212 -
 213
213 -
 214
214 -
 215
215 -
 216
216 -
 217
217 -
 218
218 -
 219
219 -
 220
220 -
 221
221 -
222
-
223
-
224
-
225
-
226
-
227
-
228
-
229
-
230
-
231
-
232
-
233
-
234
-
235
-
236
-
237
-
238
-
239
-
240
-
241
-
242
-
243
-
244
-
245
-
246
-
247
-
248
-
249
-
250
-
251
-
252
-
253
-
254
-
255
-
256
-
257
-
258
-
259
-
260
-
261
-
262
-
263
-
264
-
265
-
266
-
267
-
268
-
269
-
270
-
271
-
272
-
273
-
274
-
275
-
276
-
277
-
278
-
279
-
280
-
281
-
282
-
283
-
284
-
285
-
286
-
287
-
288
-
289
-
290
-
291
-
292
-
293
-
294
-
295
-
296
-
297
-
298
-
299
-
300
-
301
-
302
-
303
-
304
-
305
-
306
-
307
-
308
-
309
-
310
-
311
-
312
-
313
-
314
-
315
-
316
-
317
-
318
-
319
-
320
-
321
-
322
-
323
-
324
-
325
-
326
-
327
-
328
-
329
-
330
-
331
-
332
-
333
-
334
-
335
-
336
-
337
-
338
-
339
-
340
-
341
-
342
-
343
-
344
-
345
-
346
-
347
-
348
-
349
-
350
-
351
-
352
-
353
-
354
-
355
-
356
-
357
-
358
-
359
-
360
-
361
-
362
-
363
-
364
-
365
-
366
-
367
-
368
-
369
-
370
-
371
-
372
-
373
-
374
-
375
-
376
-
377
-
378
-
379
-
380
-
381
-
382
-
383
-
384
-
385
-
386
-
387
-
388
-
389
-
390
-
391
-
392
-
393
-
394
-
395
-
396
-
397
-
398
-
399
-
400
-
401
-
402
-
403
-
404
-
405
-
406
-
407
-
408
-
409
-
410
-
411
-
412
-
413
-
414
-
415
-
416
-
417
-
418
-
419
-
420
-
421
-
422
-
423
-
424
-
425
-
426
-
427
-
428
-
429
-
430
-
431
-
432
-
433
-
434
-
435
-
436
-
437
-
438
-
439
-
440
-
441
-
442
-
443
-
444
-
445
-
446
-
447
-
448
-
449
-
450
-
451
-
452
-
453
-
454
-
455
-
456
-
457
-
458
-
459
-
460
-
461
-
462
-
463
-
464
-
465
-
466
-
467
-
468
-
469
-
470
-
471
-
472
-
473
-
474
-
475
-
476
-
477
-
478
-
479
-
480
-
481
-
482
-
483
-
484
-
485
-
486
-
487
-
488
-
489
-
490
-
491
-
492
-
493
-
494
-
495
-
496
-
497
-
498
-
499
-
500
-
501
-
502
-
503
-
504
 |
 |

209
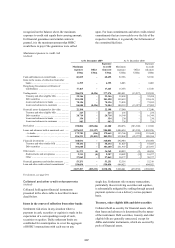
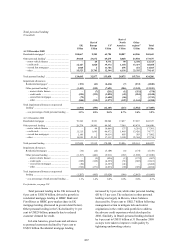
US$143 billion, 56 per cent). This included
US$22 billion (2008: US$32 billion) of treasury
and other eligible bills. Corporate debt and other
securities were US$84 billion or 32 per cent of
overall trading securities, in line with 2008’s level of
US$83 billion. Included within total securities
held for trading were US$41 billion (2008:
US$50 billion) of debt securities issued by banks
and other financial institutions.
A more detailed analysis of securities held for
trading is set out in Note 16 on the Financial
Statements and an analysis of credit quality is
provided on page 225.
Debt securities, treasury and other eligible bills
(Unaudited)
At US$360 billion, total financial investments
excluding equity securities were 23 per cent higher
at 31 December 2009 than at the end of 2008. Debt
securities, at US$302 billion, represented the largest
concentration of financial investments at 84 per cent
of the total, compared with US$252 billion (86 per
cent) at 31 December 2008. HSBC’s holdings of
corporate debt, ABSs and other securities were
spread across a wide range of issuers and
geographical regions, with 37 per cent invested in
securities issued by banks and other financial
institutions. In total, holdings in ABSs decreased by
US$8 billion due to a combination of movements in
fair values, principal amortisations and write-downs.
Total financial investments excluding equity
securities increased by 23 per cent to
US$360 billion in 2009.
Investments in securities of governments and
government agencies of US$171 billion were 46 per
cent of overall financial investments, 8 percentage
points higher than in 2008. US$58 billion of these
investments comprised treasury and other eligible
bills.
A more detailed analysis of financial
investments is set out in Note 19 on the Financial
Statements and an analysis by credit quality is
provided on page 225.
The insurance businesses held diversified
portfolios of debt and equity securities designated
at fair value (2009: US$25 billion; 2008:
US$20 billion) and debt securities classified as
financial investments (2009: US$35 billion; 2008:
US$28 billion). A more detailed analysis of
securities held by the insurance businesses is set
out on page 273.
Derivatives
(Unaudited)
Derivative assets at 31 December 2009 were
US$251 billion, a decline of 49 per cent from
31 December 2008, primarily in foreign exchange,
interest rate and credit derivatives. The main drivers
of the reduction were fair value movements across
the entire portfolio arising from lower levels of
volatility within the financial markets, steepening
yield curves and narrowing credit spreads.
Exposure to derivative assets fell by 49 per
cent in 2009 to US$251 billion.
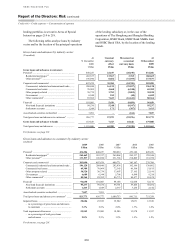
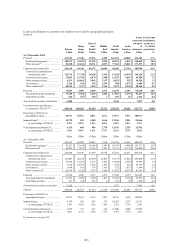
Loans and advances
(Unaudited)
At constant exchange rates, gross loans and advances
to customers (excluding the financial sector) at
31 December 2009 declined by US$83 billion or
9 per cent from 31 December 2008.
Personal lending represented 47 per cent of
total gross loans and advances to customers.
Residential mortgages of US$261 billion represented
28 per cent of total gross advances to customers and
constituted the Group’s largest concentration in
a single exposure type. As a result of continued
run-off in the US consumer finance exit portfolios,
personal lending within North America fell to be
broadly in line with European exposure.
Corporate, commercial and financial lending,
including settlement accounts, amounted to 52 per
cent of total gross loans and advances to customers
at 31 December 2009. The largest industry
concentrations were to non-bank financial
institutions and commercial real estate lending at
10 per cent and 8 per cent, respectively, of total
gross lending to customers.
Exposure to non-bank financial institutions
principally comprised secured lending on trading
accounts, primarily through repo facilities.
Commercial, industrial and international trade
lending declined moderately in 2009, falling as a
proportion of total lending by a single percentage
point to 21 per cent of total gross loans and advances
to customers. Within this category, the largest
concentration of lending was to the service sector,
which amounted to 6 per cent of total gross lending
to customers.
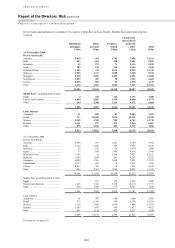
Loans and advances to banks were widely
distributed across major institutions in 2009.
Further discussion of significant movements in
credit quality of the personal lending and wholesale