Enom 2015 Annual Report Download - page 98
Download and view the complete annual report
Please find page 98 of the 2015 Enom annual report below. You can navigate through the pages in the report by either clicking on the pages listed below, or by using the keyword search tool below to find specific information within the annual report.-
 1
1 -
2
-
3
-
4
-
5
-
6
-
7
-
8
-
9
-
10
-
11
-
12
-
13
-
14
-
15
-
16
-
17
-
18
-
19
-
20
-
21
-
22
-
23
-
24
-
25
-
26
-
27
-
28
-
29
-
30
-
31
-
32
-
33
-
34
-
35
-
36
-
37
-
38
-
39
-
40
-
41
-
42
-
43
-
44
-
45
-
46
-
47
-
48
-
49
-
50
-
51
-
52
-
53
-
54
-
55
-
56
-
57
-
58
-
59
-
60
-
61
-
62
-
63
-
64
-
65
-
66
-
67
-
68
-
69
-
70
-
71
-
72
-
73
-
74
-
75
-
76
-
77
-
78
-
79
-
80
-
81
-
82
-
83
-
84
-
85
-
86
-
87
-
 88
88 -
 89
89 -
 90
90 -
 91
91 -
 92
92 -
 93
93 -
 94
94 -
 95
95 -
 96
96 -
 97
97 -
 98
98 -
 99
99 -
 100
100 -
 101
101 -
 102
102 -
 103
103 -
 104
104 -
 105
105 -
 106
106 -
 107
107 -
 108
108 -
109
-
110
 |
 |

F-34
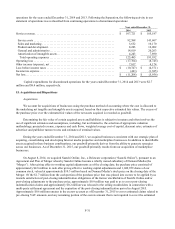
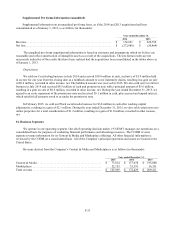
Revenue by geographic region, as determined based on the location of our customers or the anticipated destination
of use was as follows:
Year ended December 31,
2015
2014
2013
Domestic ....................................................
$
107,258
$
152,437
$
196,499
International ..................................................
18,711
19,992
12,912
Total revenue .........................................
$
125,969
$
172,429
$
209,411
17. Concentrations
Concentrations of Credit and Business Risk
Financial instruments that potentially subject us to a concentration of credit risk consist of cash and cash
equivalents, marketable securities and accounts receivable.
At December 31, 2015, our cash and cash equivalents and marketable securities were maintained primarily with
six major U.S. financial institutions and three foreign banks. We also have used three Internet payment processors in
both periods. Deposits with these institutions at times exceed the federally insured limits, which potentially subject us to
concentration of credit risk. We have not experienced any losses related to these balances and believe that there is
minimal risk.
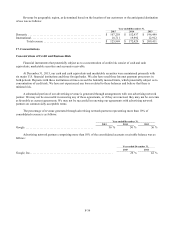
A substantial portion of our advertising revenue is generated through arrangements with one advertising network
partner. We may not be successful in renewing any of these agreements, or if they are renewed, they may not be on terms
as favorable as current agreements. We may not be successful in renewing our agreements with advertising network
partners on commercially acceptable terms.
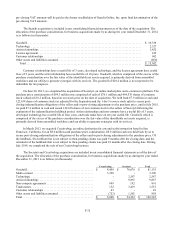
The percentage of revenue generated through advertising network partners representing more than 10% of
consolidated revenue is as follows:
Year ended December 31,
2015
2014
2013
Google ................................................
36
%
50
%
56
%
Advertising network partners comprising more than 10% of the consolidated accounts receivable balance was as
follows:
Year ended December 31,
2015
2014
Google, Inc. ..........................................................
26
%
42
%