Enom 2015 Annual Report Download - page 38
Download and view the complete annual report
Please find page 38 of the 2015 Enom annual report below. You can navigate through the pages in the report by either clicking on the pages listed below, or by using the keyword search tool below to find specific information within the annual report.-
 1
1 -
2
-
3
-
4
-
5
-
6
-
7
-
8
-
9
-
10
-
11
-
12
-
13
-
14
-
15
-
16
-
17
-
18
-
19
-
20
-
21
-
22
-
23
-
24
-
25
-
26
-
27
-
 28
28 -
 29
29 -
 30
30 -
 31
31 -
 32
32 -
 33
33 -
 34
34 -
 35
35 -
 36
36 -
 37
37 -
 38
38 -
 39
39 -
 40
40 -
 41
41 -
 42
42 -
 43
43 -
 44
44 -
 45
45 -
 46
46 -
 47
47 -
 48
48 -
49
-
50
-
51
-
52
-
53
-
54
-
55
-
56
-
57
-
58
-
59
-
60
-
61
-
62
-
63
-
64
-
65
-
66
-
67
-
68
-
69
-
70
-
71
-
72
-
73
-
74
-
75
-
76
-
77
-
78
-
79
-
80
-
81
-
82
-
83
-
84
-
85
-
86
-
87
-
88
-
89
-
90
-
91
-
92
-
93
-
94
-
95
-
96
-
97
-
98
-
99
-
100
-
101
-
102
-
103
-
104
-
105
-
106
-
107
-
108
-
109
-
110
 |
 |
36
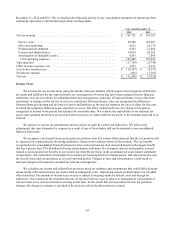
Item 7. Management’s Discussion and Analysis of Financial Condition and Results of Operations
The following discussion and analysis of our financial condition and results of operations should be read in
conjunction with Part II, Item 6, “Selected Financial Data” and our consolidated financial statements included
elsewhere in this Annual Report on Form 10-K. In addition to historical data, this discussion contains forward-looking
statements about our business, operations and financial performance based on current expectations that involve risks,
uncertainties and assumptions. Our actual results may differ materially from those discussed in the forward-looking
statements as a result of various factors, including but not limited to those discussed in “Special Note Regarding
Forward-Looking Statements” and Item I, Part 1A, “Risk Factors” included elsewhere in this Annual Report on
Form 10-K.
Overview
We are a diversified Internet company that builds platforms across its media and marketplaces properties to
enable communities of creators to reach passionate audiences in large and growing lifestyle categories. Our business is
comprised of two service offerings: Content & Media and Marketplaces.
Content & Media
Our Content & Media service offering includes our leading owned and operated online properties that publish
media content, including text articles, videos, photographs and designed visual formats. This content is published across
several key categories on eHow, a do-it-yourself and how-to reference destination; Livestrong.com, a health and healthy
living destination; Cracked, a humor site offering original and engaging comedy-driven video series, text articles and
blogs; and certain other niche properties focused on specific interests. Additionally, our studioD business develops and
executes content marketing strategies and creates custom content for third-party brands, advertisers and publishers.
Our Content & Media service offering derives the majority of its revenue from the sale of advertising on our
online properties. Our advertising revenue is principally dependent on the number of visits to our properties and the
corresponding ad unit rates. Since 2011, the total number of visits to our properties, particularly eHow, has substantially
declined due to lower search engine referrals resulting from ongoing changes to search engine algorithms by Google,
Yahoo! and Bing, as well as our decision to remove low quality and duplicative content. We have also experienced
lower ad monetization due to industry declines in cost-per-click ad rates and our decision to reduce the number of ads
per page on certain articles. In addition, visits across our online properties continue to shift from desktop to mobile, with
ad unit rates for mobile generally lower than desktop. Future changes to search engine algorithms that negatively impact
the volume of referral traffic, declines in ad unit rates, or increased availability of ad blocking software, particularly on
mobile devices, could result in a material adverse effect to our business and results of operations.
We believe that there are opportunities to increase the number of visits to our online properties, both from direct
visits by users and search engine referrals, by building high-quality products that provide a better user experience and
lead to increased engagement. Since 2013, we have focused our efforts on redesigning our websites; refining our content
library; rationalizing ad unit density; and developing a greater variety of content formats, particularly formats better
suited for mobile devices. We have also recently started a new initiative to work with a network of contributors and
influencers to create more authoritative and engaging content. These changes could negatively impact revenue and
increase our operating expenses in the near term, but we believe that by providing consumers with an improved user and
content experience, we will be able to increase the number of visits and revenue in a sustained fashion over the long-
term. We also believe there are opportunities to increase our advertising revenue by optimizing our ad product stack and
increasing branded ad sales through direct sellers and by offering more innovative products such as native
advertisements and sponsored ad placements. However, if the overall ad unit rates we receive continue to decline, we
could experience lower advertising revenue even if the number of visits to our properties increases.
Historically, the majority of our advertising revenue has been generated by our relationship with Google. While
Google continues to be our primary ad vendor for ad monetization, in 2015 we began to significantly diversify our
monetization partners and will continue to do so going forward. Google also serves as one of our primary technology