Enom 2015 Annual Report Download - page 40
Download and view the complete annual report
Please find page 40 of the 2015 Enom annual report below. You can navigate through the pages in the report by either clicking on the pages listed below, or by using the keyword search tool below to find specific information within the annual report.-
 1
1 -
2
-
3
-
4
-
5
-
6
-
7
-
8
-
9
-
10
-
11
-
12
-
13
-
14
-
15
-
16
-
17
-
18
-
19
-
20
-
21
-
22
-
23
-
24
-
25
-
26
-
27
-
28
-
29
-
 30
30 -
 31
31 -
 32
32 -
 33
33 -
 34
34 -
 35
35 -
 36
36 -
 37
37 -
 38
38 -
 39
39 -
 40
40 -
 41
41 -
 42
42 -
 43
43 -
 44
44 -
 45
45 -
 46
46 -
 47
47 -
 48
48 -
 49
49 -
 50
50 -
51
-
52
-
53
-
54
-
55
-
56
-
57
-
58
-
59
-
60
-
61
-
62
-
63
-
64
-
65
-
66
-
67
-
68
-
69
-
70
-
71
-
72
-
73
-
74
-
75
-
76
-
77
-
78
-
79
-
80
-
81
-
82
-
83
-
84
-
85
-
86
-
87
-
88
-
89
-
90
-
91
-
92
-
93
-
94
-
95
-
96
-
97
-
98
-
99
-
100
-
101
-
102
-
103
-
104
-
105
-
106
-
107
-
108
-
109
-
110
 |
 |

38
Content & Media Metrics
x Visits: We define visits as the total number of times users access our content across (a) one of our owned and
operated online properties and/or (b) one of our customers’ online properties, to the extent that the visited
customer web pages are hosted by our content services. In each case, breaks of access of at least 30 minutes
constitute a unique visit.
x Revenue per visit (“RPV”): We define RPV as Content & Media revenue per one thousand visits.
Marketplaces Metrics
x Number of transactions: We define transactions as the total number of successfully completed transactions during
the applicable period.
x Average revenue per transaction: We calculate average revenue per transaction by dividing Marketplaces revenue
for a period by the number of transactions in that period.
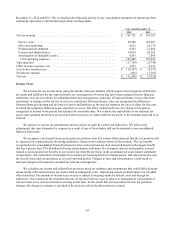
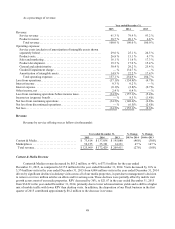
The following table sets forth our key business metrics for the periods presented:
% Change
% Change
2015
2014
2013
2015
2014
Content & Media Metrics(1):
Visits (in thousands) ................
3,374,385
4,004,287
4,031,514
(16)
%
(1)
%
Revenue per Visit ..................
$
21.87
$
34.22
$
48.39
(36)
%
(29)
%
Marketplaces Metrics(1):
Number of Transactions .............
925,111
715,343
277,442
29
%
158
%
Average Revenue per Transaction ....
$
56.38
$
49.47
$
51.65
14
%
(4)
%
(1) For a discussion of these period-to-period changes in the number of visits, RPV, number of transactions and average revenue per transaction and
how they impacted our financial results, see “Results of Operations” below.
Basis of Presentation
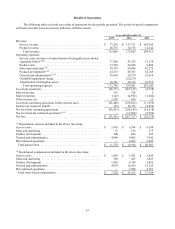
Revenue
Our revenue is primarily derived from sales of advertising and from products and services sold through our online
marketplaces.
Service Revenue
Content & Media
We generate Content & Media service revenue primarily from advertisements displayed on our online properties
and on certain webpages of our content channel customers’ online properties that are hosted by our content services.
Articles, videos and other forms of content generate advertising revenue from a diverse mix of advertising methods
including performance-based cost-per-click advertising, in which an advertiser pays only when a visitor clicks on an
advertisement; display advertisements, where revenue is dependent upon the number of advertising impressions
delivered; native advertisements, which are advertisements created to match the form and function of the platform on
which they appear; sponsored content; or advertising links. At times we enter into revenue-sharing arrangements with
our customers, and if we are considered the primary obligor, we report the underlying revenue on a gross basis in our
consolidated statements of operations and record the revenue-sharing payments to our customers in service costs.