Enom 2015 Annual Report Download - page 52
Download and view the complete annual report
Please find page 52 of the 2015 Enom annual report below. You can navigate through the pages in the report by either clicking on the pages listed below, or by using the keyword search tool below to find specific information within the annual report.-
 1
1 -
2
-
3
-
4
-
5
-
6
-
7
-
8
-
9
-
10
-
11
-
12
-
13
-
14
-
15
-
16
-
17
-
18
-
19
-
20
-
21
-
22
-
23
-
24
-
25
-
26
-
27
-
28
-
29
-
30
-
31
-
32
-
33
-
34
-
35
-
36
-
37
-
38
-
39
-
40
-
41
-
 42
42 -
 43
43 -
 44
44 -
 45
45 -
 46
46 -
 47
47 -
 48
48 -
 49
49 -
 50
50 -
 51
51 -
 52
52 -
 53
53 -
 54
54 -
 55
55 -
 56
56 -
 57
57 -
 58
58 -
 59
59 -
 60
60 -
 61
61 -
 62
62 -
63
-
64
-
65
-
66
-
67
-
68
-
69
-
70
-
71
-
72
-
73
-
74
-
75
-
76
-
77
-
78
-
79
-
80
-
81
-
82
-
83
-
84
-
85
-
86
-
87
-
88
-
89
-
90
-
91
-
92
-
93
-
94
-
95
-
96
-
97
-
98
-
99
-
100
-
101
-
102
-
103
-
104
-
105
-
106
-
107
-
108
-
109
-
110
 |
 |
50
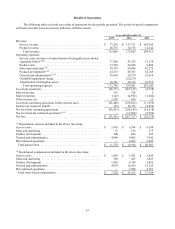
Service costs for the year ended December 31, 2014 decreased by approximately $7.9 million, or 16%, to $43.3
million compared to $51.3 million for the year ended December 31, 2013. The decrease in service costs was primarily
due to decreases of $2.8 million in depreciation expense, $2.4 million in ad serving costs, $1.8 million in traffic
acquisition costs, $1.7 million related to newly created content, $1.0 million in personnel related costs, including stock-
based compensation expense, and $0.1 million in information technology expense. These factors were partially offset by
a $1.9 million increase in content remediation related expenses.
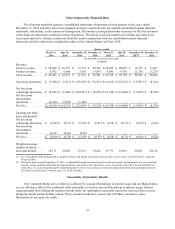
Product Costs
Product costs for the year ended December 31, 2015 increased by $7.7 million, or 30%, to $33.8 million compared
to product costs of $26.1 million for the year ended December 31, 2014, primarily due to increased costs related to the
higher volume of products sold on Society6.
Product costs for the year ended December 31, 2014 increased by $16.2 million, or 164%, to $26.1 million
compared to product costs of $9.9 million for the year ended December 31, 2013, primarily due to increased costs
related to the higher volume of products sold on Society6. The year ended December 31, 2014 represented our first full
year of product costs related to Society6, which was acquired in June 2013.
Sales and Marketing
Sales and marketing expenses increased by $0.3 million, or 1%, to $20.3 million for the year ended
December 31, 2015 from $20.0 million for the year ended December 31, 2014. The increase in expense was driven by a
$2.4 million increase in marketing expenses from Society6 and studioD, partially offset by decreases in personnel related
costs, including stock-based compensation expense, of $1.7 million and consulting expenses of $0.4 million.
Sales and marketing expenses decreased by $16.2 million, or 45%, to $20.0 million for the year ended
December 31, 2014 from $36.3 million for the year ended December 31, 2013. The decrease was driven by a $13.1
million decrease in personnel related costs, including stock-based compensation expense, primarily due to our shift away
from direct advertising sales, a $2.6 million reduction in marketing and branding activities, and a $0.5 million decrease
in software licensing fees.
Product Development
Product development expenses decreased by $5.1 million, or 17%, to $24.3 million for the year ended
December 31, 2015 compared to $29.4 million for the year ended December 31, 2014. The decrease was driven by a
$4.8 million reduction in personnel related costs, including stock-based compensation expense, and a $0.3 million
decrease in depreciation expense.
Product development expenses decreased by $2.8 million, or 9%, to $29.4 million for the year ended
December 31, 2014 compared to $32.2 million for the year ended December 31, 2013. The decrease was driven by a
$2.5 million reduction in personnel related costs, including stock-based compensation expense, as well as a $0.3 million
decrease in consulting expense.
General and Administrative
General and administrative expenses decreased by $11.8 million, or 24%, to $38.3 million for the year ended
December 31, 2015 compared to $50.2 million for the year ended December 31, 2014. The decrease was primarily due
to decreases of $9.3 million in personnel and related costs, including stock-based compensation expense, $1.4 million in
legal and audit fees, $0.5 million in facilities costs, and $0.2 million in taxes and insurance costs.
General and administrative expenses decreased by $2.8 million, or 5%, to $50.2 million for the year ended
December 31, 2014 compared to $53.0 million for the year ended December 31, 2013. The decrease was primarily due
to decreases of $2.3 million in facilities and related costs, $1.2 million in personnel and related costs, including stock-