Enom 2015 Annual Report Download - page 57
Download and view the complete annual report
Please find page 57 of the 2015 Enom annual report below. You can navigate through the pages in the report by either clicking on the pages listed below, or by using the keyword search tool below to find specific information within the annual report.55
Year ended December 31, 2014
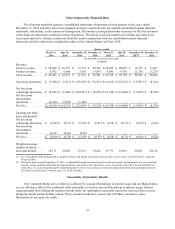
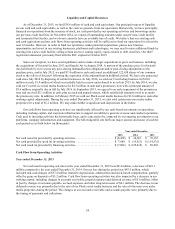
Net cash provided by operating activities in the year ended December 31, 2014 was $34.7 million, a decrease of
$41.5 million compared to the prior year. Our net loss during the period was $267.4 million, which included non-cash
charges of $232.3 million for goodwill impairment and $82.9 million related to depreciation, amortization, stock-based
compensation and debt extinguishment, partially offset by deferred taxes, gain on disposals of businesses and properties,
gain on other assets, net and other totaling $22.6 million. Cash flow from operating activities was also impacted by a
decrease in our working capital, including changes in accounts receivable and deferred revenue of $22.8 million, offset
in part by changes in accounts payable, accrued expenses, deferred registration costs, other long-term assets and deposits
with registries of $13.3 million. The increase in our deferred revenue was primarily due to growth in our former registrar
service during the period. The decrease in accrued expenses is reflective of increases in amounts due to certain vendors
and our employees resulting from growth in our business, while the changes in our accounts receivable and accounts
payable were primarily due to the timing of payments and collections.
Year ended December 31, 2013
Net cash provided by operating activities in the year ended December 31, 2013 was $76.2 million, a decrease of
$14.8 million compared to the prior year. Our net loss during the period was $20.2 million, which included non-cash
charges of $96.2 million related to depreciation, amortization, stock-based compensation, and deferred taxes, partially
offset by gain on other assets, net and other of $5.1 million. Cash flow from operating activities was also impacted by an
increase in our working capital, including changes in accounts receivable, deferred revenue and accounts payable of
$24.8 million, offset in part by changes in prepaid expenses and other current assets, accrued expenses, other long-term
assets, deferred registration costs, and deposits with registries of $19.6 million. The increases in our deferred revenue
and deferred registration costs were primarily due to growth in our former registrar business during the period, while the
decrease in our accounts receivable balances was primarily due to timing of collections.
Cash Flow from Investing Activities
Year ended December 31, 2015
Net cash provided by investing activities was $7.1 million for the year ended December 31, 2015. Cash provided
by investing activities for the year ended December 31, 2015 included $5.1 million total from the sales of our Pluck
business and certain niche media properties, $5.1 million from the early repayment of a promissory note to us, $1.0
million received from a disposition holdback and $0.7 million from restricted deposits. Cash used in investing activities
for the year ended December 31, 2015 related to investments of $4.7 million in property and equipment, primarily
comprised of investments in servers and IT equipment, fixtures and fittings, leasehold improvements and internally
developed software, and investments of $0.1 million in intangible assets, primarily comprised of media content.
Year ended December 31, 2014
Net cash used in investing activities was $14.9 million for the year ended December 31, 2014, and included
investments of $8.9 million in property and equipment, primarily comprised of servers and IT equipment, fixtures and
fittings, leasehold improvements and internally developed software, and investments of $5.7 million in intangible assets,
primarily composed of media content. Cash flows from investing activities for the year ended December 31, 2014 also
included cash inflows of $13.7 million from the sales of businesses, including Creativebug and CoveritLive, as well as
outflows of $2.2 million as partial consideration to acquire Saatchi Art, and $3.1 million of restricted cash comprised of
a $1.7 million holdback amount paid by us as part of the Saatchi Art consideration and $1.4 million for a standby letter
of credit we cash collateralized in connection with the payment arrangement for our Santa Monica office lease. In
connection with our former domain name business, we made net payments for gTLD applications of $15.8 million and
received cash proceeds of $6.1 million from the withdrawals of our interest in certain gTLD applications during the year
ended December 31, 2014.


