Enom 2015 Annual Report Download - page 50
Download and view the complete annual report
Please find page 50 of the 2015 Enom annual report below. You can navigate through the pages in the report by either clicking on the pages listed below, or by using the keyword search tool below to find specific information within the annual report.-
 1
1 -
2
-
3
-
4
-
5
-
6
-
7
-
8
-
9
-
10
-
11
-
12
-
13
-
14
-
15
-
16
-
17
-
18
-
19
-
20
-
21
-
22
-
23
-
24
-
25
-
26
-
27
-
28
-
29
-
30
-
31
-
32
-
33
-
34
-
35
-
36
-
37
-
38
-
39
-
 40
40 -
 41
41 -
 42
42 -
 43
43 -
 44
44 -
 45
45 -
 46
46 -
 47
47 -
 48
48 -
 49
49 -
 50
50 -
 51
51 -
 52
52 -
 53
53 -
 54
54 -
 55
55 -
 56
56 -
 57
57 -
 58
58 -
 59
59 -
 60
60 -
61
-
62
-
63
-
64
-
65
-
66
-
67
-
68
-
69
-
70
-
71
-
72
-
73
-
74
-
75
-
76
-
77
-
78
-
79
-
80
-
81
-
82
-
83
-
84
-
85
-
86
-
87
-
88
-
89
-
90
-
91
-
92
-
93
-
94
-
95
-
96
-
97
-
98
-
99
-
100
-
101
-
102
-
103
-
104
-
105
-
106
-
107
-
108
-
109
-
110
 |
 |

48
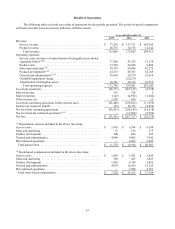
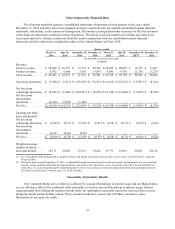
As a percentage of revenue:
Year ended December 31,
2015
2014
2013
Revenue:
Service revenue ............................................
61.3
%
79.9
%
93.2
%
Product revenue ............................................
38.7
%
20.1
%
6.8
%
Total revenue ............................................
100.0
%
100.0
%
100.0
%
Operating expenses:
Service costs (exclusive of amortization of intangible assets shown
separately below) ...........................................
29.6
%
25.1
%
24.5
%
Product costs ...............................................
26.8
%
15.1
%
4.7
%
Sales and marketing .........................................
16.1
%
11.6
%
17.3
%
Product development ........................................
19.3
%
17.0
%
15.4
%
General and administrative ...................................
30.4
%
29.2
%
25.4
%
Goodwill impairment charge ..................................
—
%
134.7
%
—
%
Amortization of intangible assets ..............................
14.9
%
22.2
%
17.4
%
Total operating expenses ..................................
137.1
%
254.9
%
104.7
%
Loss from operations ...........................................
(37.1)
%
(154.9)
%
(4.7)
%
Interest income ...............................................
0.3
%
0.2
%
—
%
Interest expense ...............................................
(0.1)
%
(2.8)
%
(0.7)
%
Other income, net .............................................
2.4
%
0.4
%
—
%
Loss from continuing operations before income taxes ................
(34.5)
%
(157.1)
%
(5.4)
%
Income tax (expense) benefit ....................................
—
%
8.5
%
(1.4)
%
Net loss from continuing operations ..............................
(34.5)
%
(148.6)
%
(6.8)
%
Net loss from discontinued operations .............................
—
%
(6.5)
%
(2.8)
%
Net loss ......................................................
(34.5)
%
(155.1)
%
(9.6)
%
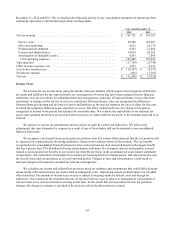
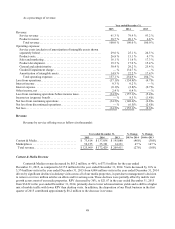
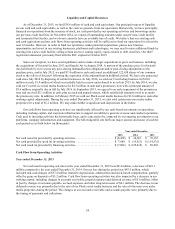
Revenue
Revenue by service offering was as follows (in thousands):
Year ended December 31,
% Change
% Change
2015
2014
2013
2015 to 2014
2014 to 2013
Content & Media ............................
$
73,814
$
137,038
$
195,080
(46)
%
(30)
%
Marketplaces ...............................
52,155
35,391
14,331
47
%
147
%
Total revenue ..............................
$
125,969
$
172,429
$
209,411
(27)
%
(18)
%
Content & Media Revenue
Content & Media revenue decreased by $63.2 million, or 46%, to $73.8 million for the year ended
December 31, 2015, as compared to $137.0 million for the year ended December 31, 2014. Visits decreased by 16% to
3,374 million visits in the year ended December 31, 2015 from 4,004 million visits in the year ended December 31, 2014
driven by significant declines in desktop visits across all of our media properties, in part due to management’s decision
to remove over two million articles on eHow and Livestrong.com. These declines were partially offset by mobile visit
growth across most of our media properties. RPV decreased by 36%, to $21.87 in the year ended December 31, 2015
from $34.22 in the year ended December 31, 2014, primarily due to lower ad monetization yields and a shift to a higher
mix of mobile traffic with lower RPV than desktop visits. In addition, the disposition of our Pluck business in the first
quarter of 2015 contributed approximately $8.2 million to the decrease in revenue.