Enom 2015 Annual Report Download - page 56
Download and view the complete annual report
Please find page 56 of the 2015 Enom annual report below. You can navigate through the pages in the report by either clicking on the pages listed below, or by using the keyword search tool below to find specific information within the annual report.-
 1
1 -
2
-
3
-
4
-
5
-
6
-
7
-
8
-
9
-
10
-
11
-
12
-
13
-
14
-
15
-
16
-
17
-
18
-
19
-
20
-
21
-
22
-
23
-
24
-
25
-
26
-
27
-
28
-
29
-
30
-
31
-
32
-
33
-
34
-
35
-
36
-
37
-
38
-
39
-
40
-
41
-
42
-
43
-
44
-
45
-
 46
46 -
 47
47 -
 48
48 -
 49
49 -
 50
50 -
 51
51 -
 52
52 -
 53
53 -
 54
54 -
 55
55 -
 56
56 -
 57
57 -
 58
58 -
 59
59 -
 60
60 -
 61
61 -
 62
62 -
 63
63 -
 64
64 -
 65
65 -
 66
66 -
67
-
68
-
69
-
70
-
71
-
72
-
73
-
74
-
75
-
76
-
77
-
78
-
79
-
80
-
81
-
82
-
83
-
84
-
85
-
86
-
87
-
88
-
89
-
90
-
91
-
92
-
93
-
94
-
95
-
96
-
97
-
98
-
99
-
100
-
101
-
102
-
103
-
104
-
105
-
106
-
107
-
108
-
109
-
110
 |
 |

54
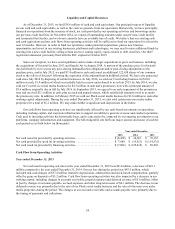
Liquidity and Capital Resources
As of December 31, 2015, we had $38.6 million of cash and cash equivalents. Our principal sources of liquidity
are our cash and cash equivalents, as well as the cash we generate from our operations. Historically, we have principally
financed our operations from the issuance of stock, net cash provided by our operating activities and borrowings under
our previous credit facilities. In November 2014, we repaid all outstanding amounts under our previous credit facility
and terminated that facility, and we do not currently have an available line of credit. We believe that our existing cash
and cash equivalents and our cash flows from operating activities will be sufficient to fund our operations for at least the
next 12 months. However, in order to fund our operations, make potential acquisitions, pursue new business
opportunities and invest in our existing businesses, platforms and technologies, we may need to raise additional funds by
entering into a new credit facility, selling certain assets or issuing equity, equity-related or debt securities. Our shelf
registration statement previously filed with the SEC expired in October 2015.
Since our inception, we have used significant cash to make strategic acquisitions to grow our business, including
the acquisitions of Society6 in June 2013 and Saatchi Art in August 2014. A portion of the purchase price for Society6
was held back by us to secure any post-closing indemnification obligations and/or post-closing adjustments to the
purchase price, and in July 2015, we paid $7.4 million in cash and issued an additional 122,638 shares of our common
stock to the sellers of Society6 following the expiration of the indemnification holdback period. We have also generated
cash since July 2014 by disposing of certain businesses. In July 2014, we sold our Creativebug business for $10.0
million in cash, $1.0 million of which was initially held in escrow and released to us in July 2015. In July 2014, we also
sold our CoveritLive social media business for $4.5 million in cash and a promissory note with a principal amount of
$5.6 million, originally due in full by July 2016. In September 2015, we agreed to an early repayment of the promissory
note and received $5.1 million in cash, plus accrued and unpaid interest, which satisfied all amounts owed to us under
the promissory note. In addition, in February 2015 we sold our Pluck social media business for $3.8 million in cash after
working capital adjustments. During the year ended December 31, 2015, we also sold certain non-core niche online
properties for a total of $1.2 million. We may make further acquisitions and dispositions in the future.
Our cash flows from operating activities are significantly affected by our cash-based investments in operations,
including working capital, and corporate infrastructure to support our ability to generate revenue and conduct operations.
Cash used in investing activities has historically been, and is expected to be, impacted by our ongoing investments in our
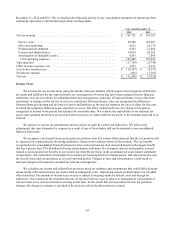
platforms, company infrastructure and equipment. The following table sets forth our major sources and (uses) of cash for
each period as set forth below (in thousands):
Year ended December,
2015
2014
2013
Net cash (used in) provided by operating activities ........................
$
(8,438)
$
34,661
$
76,163
Net cash provided by (used in) investing activities ........................
$
7,089
$
(14,921)
$
(114,535)
Net cash (used in) provided by financing activities ........................
$
(7,886)
$
(125,418)
$
89,030
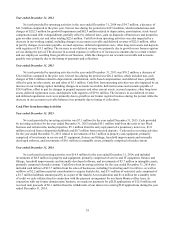
Cash Flow from Operating Activities
Year ended December 31, 2015
Net cash used in operating activities in the year ended December 31, 2015 was $8.4 million, a decrease of $43.1
million compared to the year ended December 31, 2014. Our net loss during the period was $43.5 million, which
included non-cash charges of $37.4 million related to depreciation, amortization and stock-based compensation, partially
offset by gains on disposals of $3.2 million. Cash flow from operating activities was also impacted by a decrease in our
working capital, including changes in accounts receivable, prepaid expenses and deferred revenue of $5.0 million, offset
in part by changes in accounts payable, accrued expenses and other long-term assets of $4.1 million. The decrease in our
deferred revenue was primarily due to the sale of our Pluck social media business and the sale of other non-core niche
media properties during the period. The changes in our accounts receivable and accounts payable were primarily due to
the timing of payments and collections.