Enom 2015 Annual Report Download - page 51
Download and view the complete annual report
Please find page 51 of the 2015 Enom annual report below. You can navigate through the pages in the report by either clicking on the pages listed below, or by using the keyword search tool below to find specific information within the annual report.-
 1
1 -
2
-
3
-
4
-
5
-
6
-
7
-
8
-
9
-
10
-
11
-
12
-
13
-
14
-
15
-
16
-
17
-
18
-
19
-
20
-
21
-
22
-
23
-
24
-
25
-
26
-
27
-
28
-
29
-
30
-
31
-
32
-
33
-
34
-
35
-
36
-
37
-
38
-
39
-
40
-
 41
41 -
 42
42 -
 43
43 -
 44
44 -
 45
45 -
 46
46 -
 47
47 -
 48
48 -
 49
49 -
 50
50 -
 51
51 -
 52
52 -
 53
53 -
 54
54 -
 55
55 -
 56
56 -
 57
57 -
 58
58 -
 59
59 -
 60
60 -
 61
61 -
62
-
63
-
64
-
65
-
66
-
67
-
68
-
69
-
70
-
71
-
72
-
73
-
74
-
75
-
76
-
77
-
78
-
79
-
80
-
81
-
82
-
83
-
84
-
85
-
86
-
87
-
88
-
89
-
90
-
91
-
92
-
93
-
94
-
95
-
96
-
97
-
98
-
99
-
100
-
101
-
102
-
103
-
104
-
105
-
106
-
107
-
108
-
109
-
110
 |
 |

49
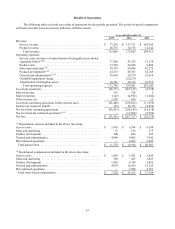
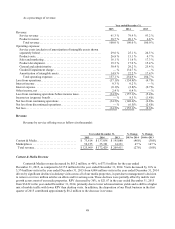
Content & Media revenue decreased by $58.0 million, or 30%, to $137.0 million for the year ended
December 31, 2014, as compared to $195.1 million for the year ended December 31, 2013. Visits decreased by 1% to
4,004 million visits in the year ended December 31, 2014 from 4,032 million visits in the year ended December 31, 2013
primarily due to declines in desktop visits from eHow, Cracked and Livestrong.com, largely offset by mobile visit
growth across most of our media properties and desktop visit growth from our international websites and customer web
pages hosted by our content channel services. RPV decreased by 29%, to $34.22 in the year ended December 31, 2014
from $48.39 in the year ended December 31, 2013, primarily due to lower ad monetization yields from cost-per-click
advertising, a reduction in higher yielding direct sold display advertising, and a mix shift to lower ad monetizing visits
from mobile and international users.
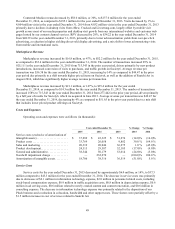
Marketplaces Revenue
Marketplaces revenue increased by $16.8 million, or 47%, to $52.2 million for the year ended December 31, 2015,
as compared to $35.4 million for the year ended December 31, 2014. The number of transactions increased 29% to
925,111 in the year ended December 31, 2015 from 715,343 in the prior year period, driven primarily by new product
introductions, increased conversion of visits to purchases, and traffic growth on Society6. Average revenue per
transaction was $56.38 for the year ended December 31, 2015, increasing by 14% as compared to $49.47 in the prior
year period due primarily to a shift towards higher priced items on Society6, as well as the addition of Saatchi Art in
August 2014, which has significantly higher average revenue per transaction.
Marketplaces revenue increased by $21.1 million, or 147%, to $35.4 million for the year ended
December 31, 2014, as compared to $14.3 million for the year ended December 31, 2013. The number of transactions
increased 158% to 715,343 in the year ended December 31, 2014 from 277,442 in the prior year period, driven primarily
by a full year of results for Society6, which we acquired in June 2013. Average revenue per transaction was $49.47 for
the year ended December 31, 2014, decreasing by 4% as compared to $51.65 in the prior year period due to a mix shift
that includes lower priced product offerings on Society6.
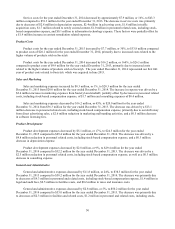
Costs and Expenses
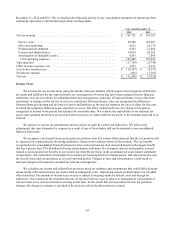
Operating costs and expenses were as follows (in thousands):
Year ended December 31,
% Change
% Change
2015
2014
2013
2015
2014
Service costs (exclusive of amortization of
intangible assets) ......................
$
37,289
$
43,325
$
51,274
(14.0)
%
(16.0)
%
Product costs .........................
33,769
26,058
9,882
30.0
%
164.0
%
Sales and marketing ...................
20,319
20,046
36,275
1.0
%
(45.0)
%
Product development ...................
24,313
29,387
32,185
(17.0)
%
(9.0)
%
General and administrative ..............
38,344
50,179
53,014
(24.0)
%
(5.0)
%
Goodwill impairment charge ............
—
232,270
—
(100.0)
%
100.0
%
Amortization of intangible assets .........
18,706
38,316
36,519
(51.0)
%
5.0
%
Service Costs
Service costs for the year ended December 31, 2015 decreased by approximately $6.0 million, or 14%, to $37.3
million compared to $43.3 million for the year ended December 31, 2014. The decrease in service costs was primarily
due to decreases of $2.1 million in information technology expense, $2.0 million in personnel related costs, including
stock-based compensation expense, $0.9 million in traffic acquisition costs, $0.8 million in depreciation expense, $0.6
million in ad serving costs, $0.6 million related to newly created content and content renovation, and $0.6 million in
consulting expense. The decrease in information technology expense was primarily related to the disposition of our
Pluck business and a reduction in colocation, bandwidth and other support costs. These factors were partially offset by a
$1.5 million increase in cost of services related to Saatchi Art.