EasyJet 2013 Annual Report Download - page 37
Download and view the complete annual report
Please find page 37 of the 2013 EasyJet annual report below. You can navigate through the pages in the report by either clicking on the pages listed below, or by using the keyword search tool below to find specific information within the annual report.-
 1
1 -
2
-
3
-
4
-
5
-
6
-
7
-
8
-
9
-
10
-
11
-
12
-
13
-
14
-
15
-
16
-
17
-
18
-
19
-
20
-
21
-
22
-
23
-
24
-
25
-
26
-
 27
27 -
 28
28 -
 29
29 -
 30
30 -
 31
31 -
 32
32 -
 33
33 -
 34
34 -
 35
35 -
 36
36 -
 37
37 -
 38
38 -
 39
39 -
 40
40 -
 41
41 -
 42
42 -
 43
43 -
 44
44 -
 45
45 -
 46
46 -
 47
47 -
48
-
49
-
50
-
51
-
52
-
53
-
54
-
55
-
56
-
57
-
58
-
59
-
60
-
61
-
62
-
63
-
64
-
65
-
66
-
67
-
68
-
69
-
70
-
71
-
72
-
73
-
74
-
75
-
76
-
77
-
78
-
79
-
80
-
81
-
82
-
83
-
84
-
85
-
86
-
87
-
88
-
89
-
90
-
91
-
92
-
93
-
94
-
95
-
96
-
97
-
98
-
99
-
100
-
101
-
102
-
103
-
104
-
105
-
106
-
107
-
108
-
109
-
110
-
111
-
112
-
113
-
114
-
115
-
116
-
117
-
118
-
119
-
120
-
121
-
122
-
123
-
124
-
125
-
126
-
127
-
128
-
129
-
130
-
131
-
132
-
133
-
134
-
135
-
136
 |
 |
35
www.easyJet.com
Strategic report
CASH FLOWS AND FINANCIAL POSITION
Summary consolidated statement of cash flows
2013
£ million
2012
£ million
Change
£ million
Net cash generated from operating activities (excluding dividends) 701 457 244
Ordinary dividend paid (85) (46) (39)
Special dividend paid – (150) 150
Net capital expenditure (416) (389) (27)
Net loan and lease finance drawdown/(repayment) 33 (314) 347
Net decrease in money market deposits 41 55 (14)
Net decrease/(increase) in restricted cash 148 (37) 185
Other including the effect of exchange rates (54) (31) (23)
Net increase/(decrease) in cash and cash equivalents 368 (455) 823
Cash and cash equivalents at beginning of year 645 1,100 (455)
Cash and cash equivalents at end of year 1,013 645 368
Money market deposits at end of year 224 238 (14)
Cash and money market deposits at end of year 1,237 883 354
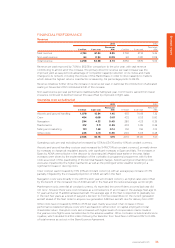
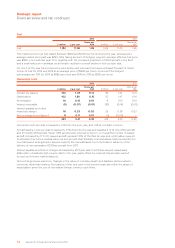
easyJet generated strong operating cash flow in the year principally driven by growth in revenue per seat
and forward bookings.
Net capital expenditure includes the acquisition of 10 A320 aircraft (2012: 19 A320 aircraft), the purchase
of life-limited parts used in engine restoration and the pre-delivery payments made on aircraft purchases.
Net loan and finance repayment comprises £316 million proceeds received on 24 aircraft sale and leaseback
transactions entered into in the year, offset by £283 million debt repayment. £186 million of this related to
loans repaid early as part of easyJet’s liquidity management strategy.
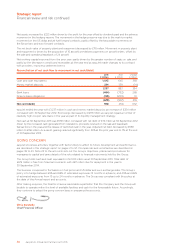
Movement in restricted cash relates to the recalling of £130 million of previously held restricted cash to free
cash as easyJet made changes in card acquiring service providers, reducing the requirement to hold cash
on deposit.
At the year end, the amount of customer payments in advance (“unearned revenue”) was £547 million
compared with £496 million last year.
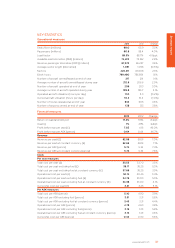
Summary consolidated statement of financial position
2013
£ million
2012
£ million
Change
£ million
Goodwill 365 365 –
Property, plant and equipment 2,280 2,395 (115)
Derivative financial instruments (71) 44 (115)
Net working capital (980) (841) (139)
Restricted cash 12 159 (147)
Net cash/(debt) 558 (74) 632
Current and deferred taxation (202) (227) 25
Other non-current assets and liabilities 55 (27) 82
2,017 1,794 223
Opening shareholders’ equity 1,794 1,705
Profit for the year 398 255
Ordinary dividend paid (85) (46)
Special dividend paid –(150)
Change in hedging reserve (97) 28
Other movements 72
2,017 1,794