EasyJet 2013 Annual Report Download - page 34
Download and view the complete annual report
Please find page 34 of the 2013 EasyJet annual report below. You can navigate through the pages in the report by either clicking on the pages listed below, or by using the keyword search tool below to find specific information within the annual report.-
 1
1 -
2
-
3
-
4
-
5
-
6
-
7
-
8
-
9
-
10
-
11
-
12
-
13
-
14
-
15
-
16
-
17
-
18
-
19
-
20
-
21
-
22
-
23
-
 24
24 -
 25
25 -
 26
26 -
 27
27 -
 28
28 -
 29
29 -
 30
30 -
 31
31 -
 32
32 -
 33
33 -
 34
34 -
 35
35 -
 36
36 -
 37
37 -
 38
38 -
 39
39 -
 40
40 -
 41
41 -
 42
42 -
 43
43 -
 44
44 -
45
-
46
-
47
-
48
-
49
-
50
-
51
-
52
-
53
-
54
-
55
-
56
-
57
-
58
-
59
-
60
-
61
-
62
-
63
-
64
-
65
-
66
-
67
-
68
-
69
-
70
-
71
-
72
-
73
-
74
-
75
-
76
-
77
-
78
-
79
-
80
-
81
-
82
-
83
-
84
-
85
-
86
-
87
-
88
-
89
-
90
-
91
-
92
-
93
-
94
-
95
-
96
-
97
-
98
-
99
-
100
-
101
-
102
-
103
-
104
-
105
-
106
-
107
-
108
-
109
-
110
-
111
-
112
-
113
-
114
-
115
-
116
-
117
-
118
-
119
-
120
-
121
-
122
-
123
-
124
-
125
-
126
-
127
-
128
-
129
-
130
-
131
-
132
-
133
-
134
-
135
-
136
 |
 |

32 easyJet plc Annual report and accounts 2013
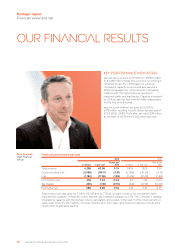
Strategic report
Financial review and risk continued
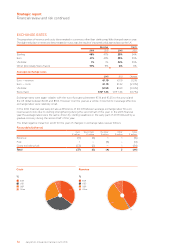
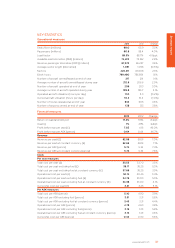
EXCHANGE RATES
The proportion of revenue and costs denominated in currencies other than sterling was little changed year on year.
The slight reduction in revenues denominated in euros was the result of improved yields earned across the UK.
Revenue Costs
2013 2012 2013 2012
Sterling 48% 47% 25% 24%
Euro 41% 43% 35% 35%
US dollar 1% 1% 34% 35%
Other (principally Swiss franc) 10% 9% 6% 6%
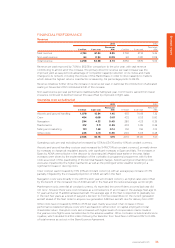
Average exchange rates
2013 2012 Change
Euro – revenue €1.19 €1.19 0.2%
Euro – costs €1.19 €1.22 (2.0%)
US dollar $1.59 $1.60 (0.5%)
Swiss franc CHF 1.45 CHF 1.46 (0.7%)
Exchange rates were again volatile, with the euro fluctuating between €1.14 and €1.25 to the pound and
the US dollar between $1.49 and $1.63. However over the year as a whole, movements in average effective
exchange rates were relatively small.
In the 2012 financial year easyJet saw a difference of €0.03 between average exchange rates for euro
revenue and costs due to sterling strengthening during the second half of the year. In the 2013 financial
year the average rates were the same, driven by sterling weakness in the early part of 2013 followed by a
gradual recovery during the second half of the year.
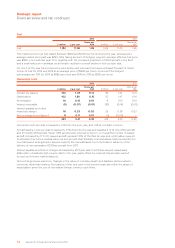
The total negative impact on profit for the year of changes in exchange rates was as follows:
Favourable/(adverse)
Euro
£ million
Swiss franc
£ million
US dollar
£ million
Other
£ million
Total
£ million
Revenue (5) (3) 1 1 (6)
Fuel 1 – (5) – (4)
Costs excluding fuel (33) (2) – 1 (34)
Total (37) (5) (4) 2 (44)
Revenue
48%
1%
10%
41%
%
USD
GBP
Other
EUR
Costs
%
USD
GBP
Other
EUR
25%
6%
35%
34%