EasyJet 2013 Annual Report Download - page 35
Download and view the complete annual report
Please find page 35 of the 2013 EasyJet annual report below. You can navigate through the pages in the report by either clicking on the pages listed below, or by using the keyword search tool below to find specific information within the annual report.-
 1
1 -
2
-
3
-
4
-
5
-
6
-
7
-
8
-
9
-
10
-
11
-
12
-
13
-
14
-
15
-
16
-
17
-
18
-
19
-
20
-
21
-
22
-
23
-
24
-
 25
25 -
 26
26 -
 27
27 -
 28
28 -
 29
29 -
 30
30 -
 31
31 -
 32
32 -
 33
33 -
 34
34 -
 35
35 -
 36
36 -
 37
37 -
 38
38 -
 39
39 -
 40
40 -
 41
41 -
 42
42 -
 43
43 -
 44
44 -
 45
45 -
46
-
47
-
48
-
49
-
50
-
51
-
52
-
53
-
54
-
55
-
56
-
57
-
58
-
59
-
60
-
61
-
62
-
63
-
64
-
65
-
66
-
67
-
68
-
69
-
70
-
71
-
72
-
73
-
74
-
75
-
76
-
77
-
78
-
79
-
80
-
81
-
82
-
83
-
84
-
85
-
86
-
87
-
88
-
89
-
90
-
91
-
92
-
93
-
94
-
95
-
96
-
97
-
98
-
99
-
100
-
101
-
102
-
103
-
104
-
105
-
106
-
107
-
108
-
109
-
110
-
111
-
112
-
113
-
114
-
115
-
116
-
117
-
118
-
119
-
120
-
121
-
122
-
123
-
124
-
125
-
126
-
127
-
128
-
129
-
130
-
131
-
132
-
133
-
134
-
135
-
136
 |
 |

33
www.easyJet.com
Strategic report
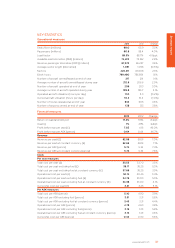
FINANCIAL PERFORMANCE
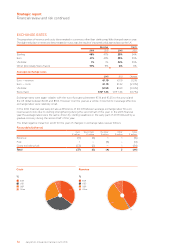
Revenue
2013 2012
£ million £ per seat
Pence per
ASK £ million £ per seat
Pence per
ASK
Seat revenue 4,194 61.64 5.65 3,794 57.61 5.26
Non-seat revenue 64 0.94 0.09 60 0.90 0.08
Total revenue 4,258 62.58 5.74 3,854 58.51 5.34
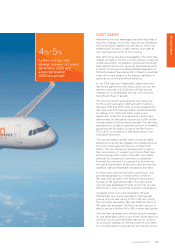
Revenue per seat improved by 7.0% to £62.58 in comparison to the prior year, with seat revenue
contributing to almost all of this increase. The primary driver for revenue per seat increase was the
improved yield, as easyJet took advantage of competitor capacity reduction on its routes and made
changes to its network, including the closure of the Madrid base, in order to drive capacity to markets
which deliver the highest returns. Load factor increased by 0.6 percentage points to 89.3%.
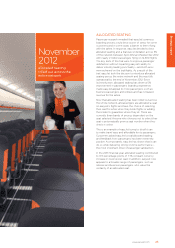
Revenue initiatives further drove the increase in revenue per seat, in particular the introduction of allocated
seating in November 2012 contributed £0.51 of this increase.
Non-seat revenue per seat performance stabilised after falling last year. Commissions earned from travel
insurance continued to decline however this was offset by improved in-flight sales.
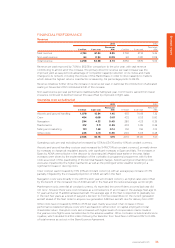
Operating costs excluding fuel
2013 2012
£ million £ per seat
Pence per
ASK £ million £ per seat
Pence per
ASK
Airports and ground handling 1,078 15.84 1.45 955 14.49 1.32
Crew 454 6.68 0.61 432 6.55 0.60
Navigation 294 4.33 0.40 280 4.25 0.39
Maintenance 212 3.11 0.29 203 3.08 0.28
Selling and marketing 101 1.49 0.14 104 1.58 0.14
Other costs 226 3.31 0.30 200 3.05 0.28
2,365 34.76 3.19 2,174 33.00 3.01
Operating costs per seat excluding fuel increased by 5.3% to £34.76 and by 4.1% at constant currency.
Airports and ground handling cost per seat increased by 9.4% (7.9% at constant currency), primarily driven
by increases in charges at regulated airports, with significant increases in Spain and Italy. The increases in
Spain by AENA were a factor in the decision to close easyJet’s Madrid base earlier in the year. Italian
increases were driven by the implementation of the ‘contratto di programma’ programme, with further
costs as a result of the quadrupling of the terminal Navaid charges. Airports and ground handling costs
were also impacted by the higher load factor as well as the prolonged winter weather resulting in a
significant increase in de-icing costs.
Crew cost per seat increased by 1.9% (1.1% at constant currency), with an average pay increase of 1.7%
partially mitigated by the increased proportion of A320 aircraft in the fleet.
Navigation costs were broadly in line with the prior year at constant currency, as higher rates were offset
by the benefit of the increased mix of A320 aircraft in the fleet and the reduced average sector length.
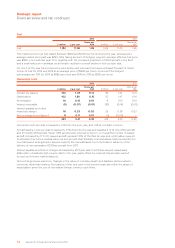
Maintenance costs were flat at constant currency. As expected, the one-off items incurred last year did
not recur, however there were cost increases as a consequence of an increase in the average fleet age to
5.1 years and a net 17 additional leased aircraft. The average age of the fleet is expected to gradually rise
in the next few years as a result of easyJet’s decision to minimise expenditure on the current generation
aircraft ahead of the fleet order to acquire new generation A320neo aircraft, due for delivery from 2017.
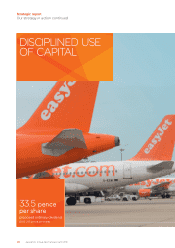
Other costs have increased by 8.5% to £3.31 per seat, mainly as a result of an increase in those
performance-related employee costs which are based on either return on capital employed or total
shareholder return. Disruption costs also increased with higher levels of compensation claims made in
the year as more flights were cancelled due to the adverse weather. Other costs also include brand licence
royalties, which doubled to £10.6 million following the transition from fixed fees in 2011 and 2012 to 0.25%
of total revenue as set out in the Brand Licence Agreement.