EasyJet 2013 Annual Report Download - page 36
Download and view the complete annual report
Please find page 36 of the 2013 EasyJet annual report below. You can navigate through the pages in the report by either clicking on the pages listed below, or by using the keyword search tool below to find specific information within the annual report.-
 1
1 -
2
-
3
-
4
-
5
-
6
-
7
-
8
-
9
-
10
-
11
-
12
-
13
-
14
-
15
-
16
-
17
-
18
-
19
-
20
-
21
-
22
-
23
-
24
-
25
-
 26
26 -
 27
27 -
 28
28 -
 29
29 -
 30
30 -
 31
31 -
 32
32 -
 33
33 -
 34
34 -
 35
35 -
 36
36 -
 37
37 -
 38
38 -
 39
39 -
 40
40 -
 41
41 -
 42
42 -
 43
43 -
 44
44 -
 45
45 -
 46
46 -
47
-
48
-
49
-
50
-
51
-
52
-
53
-
54
-
55
-
56
-
57
-
58
-
59
-
60
-
61
-
62
-
63
-
64
-
65
-
66
-
67
-
68
-
69
-
70
-
71
-
72
-
73
-
74
-
75
-
76
-
77
-
78
-
79
-
80
-
81
-
82
-
83
-
84
-
85
-
86
-
87
-
88
-
89
-
90
-
91
-
92
-
93
-
94
-
95
-
96
-
97
-
98
-
99
-
100
-
101
-
102
-
103
-
104
-
105
-
106
-
107
-
108
-
109
-
110
-
111
-
112
-
113
-
114
-
115
-
116
-
117
-
118
-
119
-
120
-
121
-
122
-
123
-
124
-
125
-
126
-
127
-
128
-
129
-
130
-
131
-
132
-
133
-
134
-
135
-
136
 |
 |

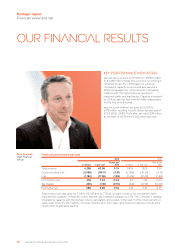
34 easyJet plc Annual report and accounts 2013
Strategic report
Financial review and risk continued
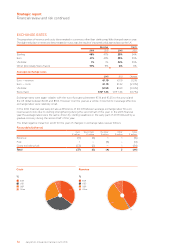
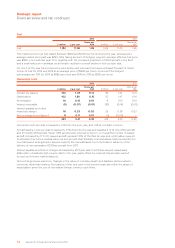
Fuel
2013 2012
£ million £ per seat
Pence per
ASK £ million £ per seat
Pence per
ASK
Fuel 1,182 17.38 1.59 1,149 17.45 1.59
The market price for jet fuel traded between $900 and $1,100 per tonne during the year, and easyJet’s
average market price paid was $992. After taking account of hedging, easyJet’s average effective fuel price
was $980, in line with last year. This, together with the increased proportion of A320 aircraft in the fleet
and a small reduction in average sector length, resulted in a small decline in fuel cost per seat.
For much of the year future fuel prices were below spot price and we have purchased forward 1.4 million
tonnes of fuel for 2014 and 2015 at an average price of $948 per tonne. As a result the hedged
percentages are 72% for 2014 at $982 per tonne and 56% for 2015 at $950 per tonne.
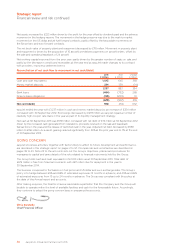
Ownership costs
2013 2012
£ million £ per seat
Pence per
ASK £ million £ per seat
Pence per
ASK
Aircraft dry leasing 102 1.49 0.14 95 1.44 0.13
Depreciation 102 1.50 0.15 97 1.47 0.14
Amortisation 10 0.15 0.01 8 0.12 0.01
Interest receivable (5) (0.07) (0.01) (10) (0.14) (0.01)
Interest payable and other
financing charges 16 0.23 0.02 25 0.38 0.03
Net exchange losses/(gains) 8 0.11 0.01 (1) (0.02) –
233 3.41 0.32 214 3.25 0.30
Ownership costs per seat increased by 5.1% from the prior year, and 1.4% at constant currency.
Aircraft leasing costs per seat increased by 3.7% driven by the sale and leaseback of 12 new A320 aircraft
and 12 mid-life A319 aircraft. Seven A319 aircraft were returned to lessors, so overall the number of leased
aircraft increased by 17 to 72. Leased aircraft represent 33% of the fleet at year end, which allows easyJet
to eliminate their future residual value risk and provide fleet flexibility over and above that provided by the
new framework arrangements. easyJet expects the owned/leased mix to fluctuate in advance of the
delivery of new generation A320neo aircraft from 2017.
Interest payable and finance charges decreased by £0.15 per seat to £0.23 as easyJet repaid early
£186 million of relatively high-coupon debt in the year, partly offset by reduced interest rates earned
on cash and money market deposits.
Net exchange losses arise from changes in the value of monetary assets and liabilities denominated in
currencies other than sterling. Fluctuations of the size seen in the last few years are within the range of
expectations given the size of the related foreign currency cash flows.