Cisco 2010 Annual Report Download - page 77
Download and view the complete annual report
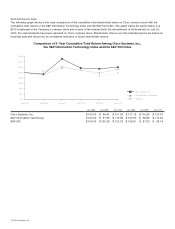
Please find page 77 of the 2010 Cisco annual report below. You can navigate through the pages in the report by either clicking on the pages listed below, or by using the keyword search tool below to find specific information within the annual report.-
 1
1 -
2
-
3
-
4
-
5
-
6
-
7
-
8
-
9
-
10
-
11
-
12
-
13
-
14
-
15
-
16
-
17
-
18
-
19
-
20
-
21
-
22
-
23
-
24
-
25
-
26
-
27
-
28
-
29
-
30
-
31
-
32
-
33
-
34
-
35
-
36
-
37
-
38
-
39
-
40
-
41
-
42
-
43
-
44
-
45
-
46
-
47
-
48
-
49
-
50
-
51
-
52
-
53
-
54
-
55
-
56
-
57
-
58
-
59
-
60
-
61
-
62
-
63
-
64
-
65
-
66
-
 67
67 -
 68
68 -
 69
69 -
 70
70 -
 71
71 -
 72
72 -
 73
73 -
 74
74 -
 75
75 -
 76
76 -
 77
77 -
 78
78 -
 79
79 -
 80
80 -
 81
81 -
 82
82 -
 83
83 -
 84
84
 |
 |
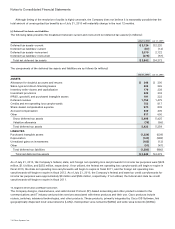
Notes to Consolidated Financial Statements
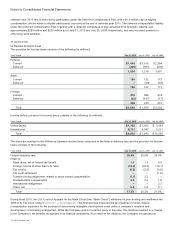
(a) Net Sales and Gross Margin by Theater
The Company conducts business globally and is primarily managed on a geographic basis. The Company’s management makes
financial decisions and allocates resources based on the information it receives from its internal management system. Sales are
attributed to a geographic theater based on the ordering location of the customer.
The Company does not allocate research and development, sales and marketing, or general and administrative expenses to its
geographic theaters in this internal management system because management does not include the information in its measurement
of the performance of the operating segments. In addition, the Company does not allocate amortization of acquisition-related
intangible assets, share-based compensation expense, charges related to asset impairments and restructurings, and certain other
charges to the gross margin for each theater because management does not include this information in its measurement of the
performance of the operating segments.
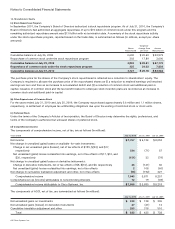
Summarized financial information by theater for fiscal 2010, 2009, and 2008, based on the Company’s internal management
system and as utilized by the Company’s Chief Operating Decision Maker (CODM), is as follows (in millions):
Years Ended July 31, 2010 July 25, 2009 July 26, 2008
Net sales:
United States and Canada(1) $ 21,740 $ 19,345 $ 21,242
European Markets 8,048 7,683 8,123
Emerging Markets 4,367 3,999 4,530
Asia Pacific 4,359 3,718 4,276
Japan 1,526 1,372 1,369
Total $ 40,040 $ 36,117 $ 39,540
Gross margin:
United States and Canada $ 14,077 $ 12,711 $ 13,917
European Markets 5,421 5,106 5,331
Emerging Markets 2,807 2,428 2,788
Asia Pacific 2,713 2,293 2,751
Japan 1,101 948 940
Theater total 26,119 23,486 25,727
Unallocated corporate items(2) (476) (392) (381)
Total $ 25,643 $ 23,094 $ 25,346
(1) Net sales in the United States were $20.4 billion, $18.2 billion, and $20.1 billion for fiscal 2010, 2009, and 2008, respectively.
(2) The unallocated corporate items include the effects of amortization of acquisition-related intangible assets; share-based compensation expense; and, for the
year ended July 25, 2009, it also includes charges related to asset impairments and restructurings.
Certain reclassifications have been made to amounts for prior years to conform to the current year’s presentation.
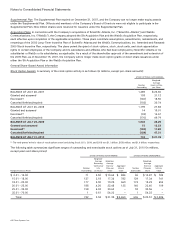
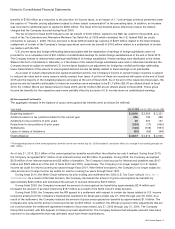
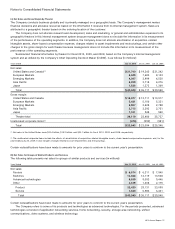
(b) Net Sales for Groups of Similar Products and Services
The following table presents net sales for groups of similar products and services (in millions):
Years Ended July 31, 2010 July 25, 2009 July 26, 2008
Net sales:
Routers $ 6,574 $ 6,311 $ 7,940
Switches 13,568 12,119 13,538
Advanced technologies 9,639 9,093 9,446
Other 2,639 1,608 2,175
Product 32,420 29,131 33,099
Service 7,620 6,986 6,441
Total $ 40,040 $ 36,117 $ 39,540
Certain reclassifications have been made to amounts for prior years to conform to the current year’s presentation.
The Company refers to some of its products and technologies as advanced technologies. For the periods presented, advanced
technologies consisted of application networking services, home networking, security, storage area networking, unified
communications, video systems, and wireless technology.
2010 Annual Report 75